MATH
NATION
The data from a survey of ages of people taking an exercise class was skewed to t...

Mathematics, 06.04.2021 22:50 kotetravels10
MATH
NATION
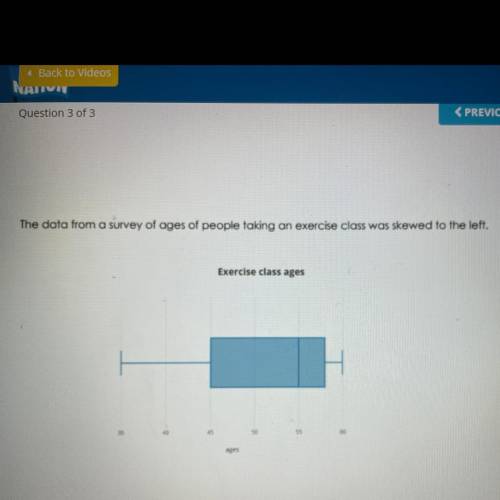
The data from a survey of ages of people taking an exercise class was skewed to the left.
Part C: The box plot represents the data. Calculate the appropriate measure of spread.
Answer choices:
A. IQR= 45
B. IQR= 13
C. Standard deviation = 8
D. Standard deviation=55

Answers: 2


Another question on Mathematics
Mathematics, 21.06.2019 16:20
Find the slope of the line that contains the following points. r(-2, 4), s(6, -2)
Answers: 1
Mathematics, 21.06.2019 19:30
The figure below shows rectangle abcd and the triangle eca on a coordinate plane.which of the following expressions represents the perimeter of triangle of triangle eca in units
Answers: 2
Mathematics, 21.06.2019 21:30
Write an equation of the line that passes through the point (2, 3) and is perpendicular to the line x = -1. a) y = 1 b) y = 3 c) y = 0 eliminate d) y = -3
Answers: 1
You know the right answer?
Questions
Mathematics, 18.12.2019 03:31


Social Studies, 18.12.2019 03:31

Biology, 18.12.2019 03:31
Mathematics, 18.12.2019 03:31

English, 18.12.2019 03:31

French, 18.12.2019 03:31
Biology, 18.12.2019 03:31
English, 18.12.2019 03:31
Chemistry, 18.12.2019 03:31
Biology, 18.12.2019 03:31
Mathematics, 18.12.2019 03:31


