
Mathematics, 06.04.2021 23:50 MartinTDL
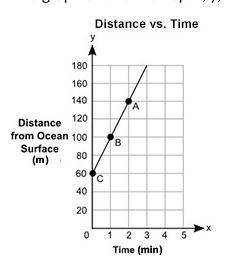
The graph shows the depth, y, in meters, of a shark from the surface of an ocean for a certain amount of time, x, in minutes:
Part A: Describe how you can use similar triangles to explain why the slope of the graph between points A and B is the same as the slope of the graph between points A and C.
Part B: What are the initial value and slope of the graph and what do they represent?

Answers: 1


Another question on Mathematics
Mathematics, 21.06.2019 22:10
Atype of plant is introduced into an ecosystem and quickly begins to take over. a scientist counts the number of plants after mmonths and develops the equation p(m)= 19.3(1.089)^m to model the situation. most recently, the scientist counted 138 plants.assuming there are no limiting factors to the growth of the plants, about how many months have passed since the plants werefirst introduced? a)o 6.1b)0.6.6c)10 72d)o 23.1
Answers: 3
Mathematics, 22.06.2019 00:20
Jubal wrote the four equations below. he examined them, without solving them, to determine which equation has no solution. which of jubal’s equations has no solution hurry
Answers: 1
You know the right answer?
The graph shows the depth, y, in meters, of a shark from the surface of an ocean for a certain amoun...
Questions


Health, 03.05.2020 13:47

Social Studies, 03.05.2020 13:47

History, 03.05.2020 13:47


Mathematics, 03.05.2020 13:47
English, 03.05.2020 13:47
Mathematics, 03.05.2020 13:47
English, 03.05.2020 13:47
Mathematics, 03.05.2020 13:47


