
Mathematics, 07.04.2021 01:40 rcfarlo9342
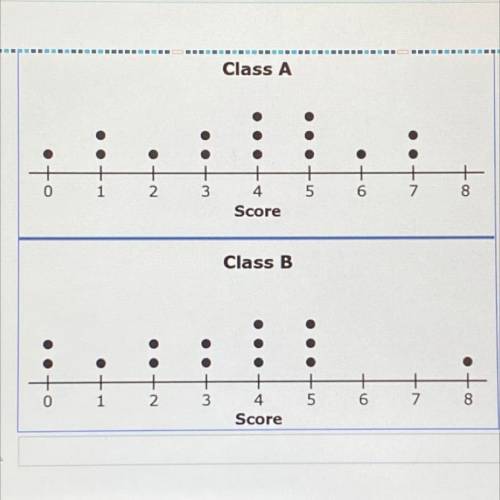
Each student is asked eight
questions and is scored on the number of correct answers. The teachers create a dot plot of the scores from 15 students from Class A and 14 students from Class B, as shown.
Another score is added to the plot for Class B to make the median of the two data sets equal.
Click on the dot plot to show
where this score could have been added.
The question is basically asking you to put a dot on top of one of the numbers in Class B where it belongs.

Answers: 2


Another question on Mathematics
Mathematics, 21.06.2019 20:00
Maurice has 54 fewer comic books than rebecca.they have 130 comic books together .how many comic books are in maurices collection ? how many comic books are in rebeccas collection
Answers: 1
Mathematics, 21.06.2019 20:00
Evaluate the discriminant of each equation. tell how many solutions each equation has and whether the solutions are real or imaginary. x^2 + 4x + 5 = 0
Answers: 2
Mathematics, 21.06.2019 20:40
Michelle is planting flowers in her garden. she wants the ratio of daises to carnations to be 3 to 2. michelle wants to plant a total of 35 flowers. how many daises should she plant?
Answers: 3
You know the right answer?
Each student is asked eight
questions and is scored on the number of correct answers. The teachers...
Questions

Business, 15.06.2021 05:10
Mathematics, 15.06.2021 05:10

Computers and Technology, 15.06.2021 05:20
Mathematics, 15.06.2021 05:20

Mathematics, 15.06.2021 05:20

Chemistry, 15.06.2021 05:20

English, 15.06.2021 05:20


Advanced Placement (AP), 15.06.2021 05:20
Mathematics, 15.06.2021 05:20
Mathematics, 15.06.2021 05:20
Health, 15.06.2021 05:20
Mathematics, 15.06.2021 05:20
Computers and Technology, 15.06.2021 05:20


