Mathematics, 07.04.2021 06:10 queennajas
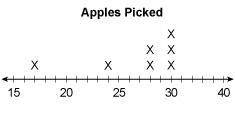
The dot plot represents the number of apples picked by a family. Explain how the outlier of the data affects the statistical summary of the data.
Select the answers from the drop-down menus to complete the statements.
The mean apples picked
Choose...
because of the outlier.
The median apples picked
Choose...
because of the outlier.
The range
Choose...
because of the outlier.


Answers: 1


Another question on Mathematics

Mathematics, 21.06.2019 18:00
Olga used 100 ounces of flour to make 225 muffins. how many ounces of flour will be used to make 300 muffins?
Answers: 2

Mathematics, 21.06.2019 18:30
Which equation represents the model shown? a)1/3 divide 1/6 = 2 b)2/3 divide 1/6 = 2/18 c)1/3 divide 1/6 = 1/18 d)2/3 divide 1/6 =4
Answers: 1

Mathematics, 21.06.2019 21:30
Hannah paid $3.20 for 16 ounces of potato chips. hank paid $3.23 for 17 ounces of potato chips. who paid less per ounces?
Answers: 1

Mathematics, 21.06.2019 22:00
Find two consexutive odd integers such that the sum of their square is 650
Answers: 2
You know the right answer?
The dot plot represents the number of apples picked by a family. Explain how the outlier of the data...
Questions


Medicine, 18.07.2019 01:30

Mathematics, 18.07.2019 01:30


Physics, 18.07.2019 01:30

Chemistry, 18.07.2019 01:30


Biology, 18.07.2019 01:30


English, 18.07.2019 01:30

Mathematics, 18.07.2019 01:30


Mathematics, 18.07.2019 01:30


Mathematics, 18.07.2019 01:30


