Mathematics, 07.04.2021 07:20 okitsfrizz2323
Pls help thank you :)
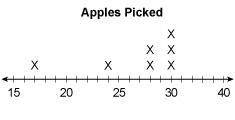
The dot plot represents the number of apples picked by a family. Explain how the outlier of the data affects the statistical summary of the data.
Select the answers from the drop-down menus to complete the statements.
The mean apples picked
increases or decreases or does not change?
because of the outlier.
The median apples picked
increases or decreases or does not change?
because of the outlier.
The range
increases or decreases or does not change?
because of the outlier.


Answers: 2


Another question on Mathematics

Mathematics, 20.06.2019 18:02
Twelve friends shared 8 small pizzas equally.how many pizzas did each person get?
Answers: 1


Mathematics, 21.06.2019 18:30
Over the last 8 nights, elyse earned the following in tips: {105, 120, 84, 95, 100, 132, 140}. if she earns $140 a night for the next four nights, which measure of center would increase more, the mean or median?
Answers: 3

Mathematics, 21.06.2019 19:00
Define multiplicative inverse. give an example of a number and its multiplicative inverse.
Answers: 1
You know the right answer?
Pls help thank you :)
The dot plot represents the number of apples picked by a family. Explain how...
Questions

Mathematics, 02.08.2019 10:00

Social Studies, 02.08.2019 10:00


Mathematics, 02.08.2019 10:00


Mathematics, 02.08.2019 10:00


History, 02.08.2019 10:00


Business, 02.08.2019 10:00


Social Studies, 02.08.2019 10:00


