
Mathematics, 07.04.2021 14:00 abelxoconda
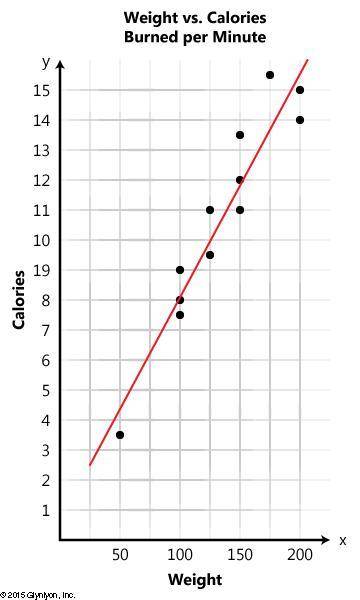
The following scatter plot represents the relationship between a person's weight and the number of calories the person burns in one minute of jump roping.
Using the line of best fit, about what weight would a person be if they burned 15 calories per minute?
150 lbs.
180 lbs.
220 lbs.
125 lbs.

Answers: 3


Another question on Mathematics
Mathematics, 22.06.2019 01:00
What is 10+10+20 about the origin the square root of a triangle.
Answers: 3
Mathematics, 22.06.2019 01:30
Which ordered pair is the best estimate for the solution of the system of equations? the graph of the system of equations : y = 3/2x +6 and y=1/4x - 2 , -3) .5, -3.5) , -4) , -3.5)
Answers: 3
Mathematics, 22.06.2019 03:00
(: the two box-and- whisker plots below show the scores on a math exam for two classes. what 2 things do the interquartile range tell you about the two classes?
Answers: 2
You know the right answer?
The following scatter plot represents the relationship between a person's weight and the number of c...
Questions


Biology, 25.02.2021 05:50
Mathematics, 25.02.2021 05:50

Arts, 25.02.2021 05:50

Mathematics, 25.02.2021 05:50
Mathematics, 25.02.2021 05:50

History, 25.02.2021 05:50
Mathematics, 25.02.2021 05:50


Social Studies, 25.02.2021 06:00

English, 25.02.2021 06:00

Spanish, 25.02.2021 06:00


