
Mathematics, 07.04.2021 15:50 michaeladkins1979
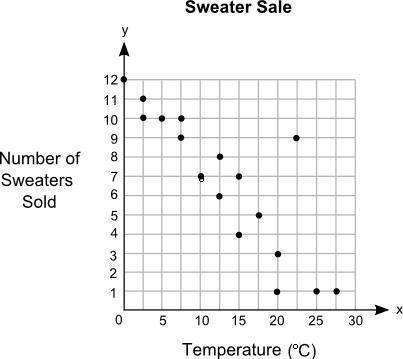
Meg plotted the graph below to show the relationship between the temperature of her city and the number of sweaters sold at a store:
Main title on the graph is Sweater Sale. Graph shows 0 to 30 on x axis at increments of 5 and 0 to 12 on y axis at increments of 1. The label on the x axis is Temperature in degree C, and the label on the y axis is Number of Sweaters Sold. Dots are made at the ordered pairs 0, 12 and 2.5, 10 and 2.5, 11 and 5, 10 and 7.5, 9 and 7.5, 10 and 10, 7 and 12.5, 6 and 12.5, 8 and 15, 4 and 15, 7 and 17.5, 5 and 20, 1 and 20, 3 and 22.5, 9 and 25, 1 and 27.5, 1.
Part A: In your own words, describe the relationship between the temperature of the city and the sale of sweaters in the city. (5 points)
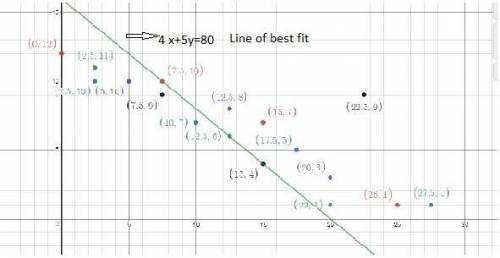
Part B: Describe how you can make the line of best fit. Write the approximate slope and y-intercept of the line of best fit. Show your work, including the points that you use to calculate slope and y-intercept. (5 points)

Answers: 2


 , Y- intercept = 16


Another question on Mathematics
Mathematics, 21.06.2019 18:40
Dexter read 11 science fiction books and 5 history books. lena read 9 science fiction books and 4 history books. compare the students’ ratios of science fiction books to history books. 1. determine the ratios’ form: science fiction books to history books 2. write the ratios as fractions: dexter: 115; lena: 94 3. rewrite with a common denominator. 4. compare. 5. answer the question. determine which shows the correct comparison of the ratios for this problem.
Answers: 1
Mathematics, 22.06.2019 02:30
Apossible wavelength for the color blue is 0.000000492 meter. which of the following is a reasonable estimate for this wavelength for the color blue? a. 5 × 10⁻⁶ m b. 5 × 10⁷ m c. 5 × 10⁻⁷ m d. 5 × 10⁶ m
Answers: 2
Mathematics, 22.06.2019 04:00
What is the answer to this equation? and if you can, find a way to show your work.
Answers: 2
You know the right answer?
Meg plotted the graph below to show the relationship between the temperature of her city and the num...
Questions
Mathematics, 20.11.2020 22:10

History, 20.11.2020 22:10

Health, 20.11.2020 22:10
Mathematics, 20.11.2020 22:10

English, 20.11.2020 22:10
Mathematics, 20.11.2020 22:10
Mathematics, 20.11.2020 22:10

Mathematics, 20.11.2020 22:10

Mathematics, 20.11.2020 22:10
Geography, 20.11.2020 22:10

Biology, 20.11.2020 22:10
Mathematics, 20.11.2020 22:10
Health, 20.11.2020 22:10
Health, 20.11.2020 22:10

Business, 20.11.2020 22:10


