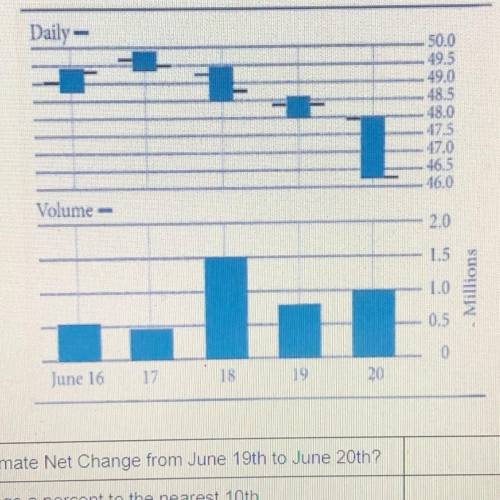
2. Use the Bar Graph to answer the following questions:
Daily -
50.0
49.5
49.0
48.5
48.0
47.5
47.0
46,5
46,0
Volume
2.0
1.5
1.0
u
Millions
0.5
0
June 16
17
18
19
20
What was the approximate Net Change from June 19th to June 20th?
Express the Net Change a percent to the nearest 10th.
The graph shows the rate at which paint is used to paint a wall.enter values to complete each statement below based on the graph.when 1 gallon of paint has been used, ( # ) square feet of the wall will be painted.the unit rate is ( # )square feet per gallon.
Afunction is given: f(x)=3x+12 a. determine the inverse of this function and name it g(x) b. use composite functions to show that these functions are inverses. c. f(g(– explain: what is the domain?
No commitments. Cancel anytime. All pricing is in US dollars (USD). The subscriptoin renews automaticaly until you cancel. For more information read our Terms of use & Privacy Policy