
Mathematics, 08.04.2021 17:20 skylar1315
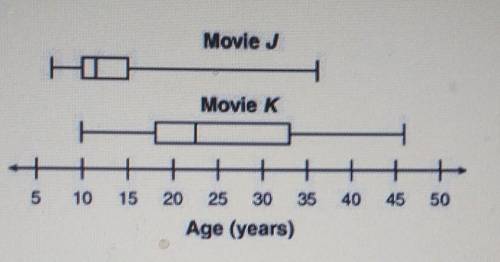
The box plots shown represent the ages of a random sample of 100 people who attended Movie J and 100 people who attended Movie K.
Which statement BEST compares the ages of the people attending Movie J and Movie K?
1 The interquartile range of the ages of the people attending Movie J is about 1/3 the interquartile range of the ages of the people attending Movie K.
2: The median age of the people attending Movie J is about 2 times the median age of the people attending Movie K.
3: The interquartile range of the ages of the people attending Movie J is about 1/2 the interquartile range of the ages of the people attending Movie K.
4: The median age of the people attending Movie J is about 3 times the median age of the people attending Movie K.

Answers: 2


Another question on Mathematics
Mathematics, 21.06.2019 14:30
Find the value of tan theta if sin theta = 12/13 and theta is in quadrant 2
Answers: 1
Mathematics, 21.06.2019 22:20
As voters exit the polls, you ask a representative random sample of voters if they voted for a proposition. if the true percentage of voters who vote for the proposition is 63%, what is the probability that, in your sample, exactly 5 do not voted for the proposition before 2 voted for the proposition? the probability is
Answers: 2
Mathematics, 21.06.2019 23:30
Find │7│. a. 1 over 7 b. –7 c. 7 asap i always mark brailiest who me so
Answers: 1
Mathematics, 21.06.2019 23:40
Full year - williamshow many square inches are in 60 square feet? 5 square inches72 square inches720 square inche8.640 square inches
Answers: 1
You know the right answer?
The box plots shown represent the ages of a random sample of 100 people who attended Movie J and 100...
Questions


Chemistry, 24.09.2019 02:50


English, 24.09.2019 02:50
Mathematics, 24.09.2019 02:50
Physics, 24.09.2019 02:50


History, 24.09.2019 02:50
History, 24.09.2019 02:50
English, 24.09.2019 02:50
Health, 24.09.2019 02:50


