Here is the histogram of a data distribution.
5 4 3 2
1'2'34'5'6'7'8'9 '10
Which best d...

Mathematics, 08.04.2021 18:40 mollywolly99
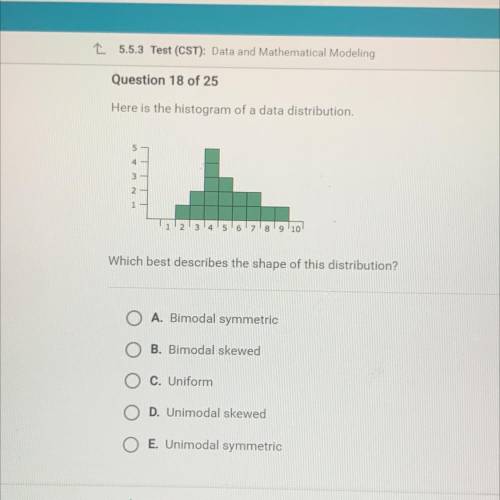
Here is the histogram of a data distribution.
5 4 3 2
1'2'34'5'6'7'8'9 '10
Which best describes the shape of this distribution?
O A. Bimodal symmetric
B. Bimodal skewed
O c. Uniform
O D. Unimodal skewed
O E. Unimodal symmetric

Answers: 3


Another question on Mathematics
Mathematics, 21.06.2019 20:00
Consider the set of all four-digit positive integers less than 2000 whose digits have a sum of 24. what is the median of this set of integers?
Answers: 1
Mathematics, 22.06.2019 02:00
The line plot below represents the number of letters written to overseas pen pals by the students at the waverly middle school.each x represents 10 students. how many students wrote more than 6 and fewer than 20 letters. a.250 b.240 c.230 d.220
Answers: 1
Mathematics, 22.06.2019 02:50
Triangle dog was rotated to create triangle d'o'g'. describe the transformation using details and degrees.
Answers: 3
Mathematics, 22.06.2019 03:30
The half-life of a certain material is 0.002 second. approximately how much of a 14-gram sample will be left after 0.004 second? a. 12 grams b. 3.5 grams c. 0.06 gram d. 7 grams
Answers: 3
You know the right answer?
Questions

Social Studies, 27.10.2019 04:43

History, 27.10.2019 04:43

Geography, 27.10.2019 04:43
Mathematics, 27.10.2019 04:43
Geography, 27.10.2019 04:43

English, 27.10.2019 04:43

Biology, 27.10.2019 04:43
Mathematics, 27.10.2019 04:43


Spanish, 27.10.2019 04:43


Mathematics, 27.10.2019 04:43


