
Mathematics, 08.04.2021 19:40 MIC620
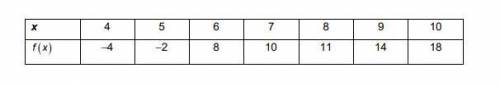
The table shows the values of a function f (x), What is the average rate of change of f (x) over the interval from x = 5 to x = 9? Show your work.

Answers: 1


Another question on Mathematics
Mathematics, 21.06.2019 14:30
Which system of linear inequalities is represented by the graph?
Answers: 2
Mathematics, 21.06.2019 21:30
High school seniors with strong academic records apply to the nation’s most selective colleges in greater numbers each year. because the number of slots remains relatively stable, some colleges reject more early applicants. suppose that for a recent admissions class, an ivy league college received 2851 applications for early admission. of this group, it admitted 1033 students early, rejected 854 outright, and deferred 964 to the regular admission pool for further consideration. in the past, this school has admitted 18% of the deferred early admission applicants during the regular admission process. counting the students admitted early and the students admitted during the regular admission process, the total class size was 2375. let e, r, and d represent the events that a student who applies for early admission is admitted early, rejected outright, or deferred to the regular admissions pool.suppose a student applies for early admission. what is the probability that the student will be admitted for early admission or be deferred and later admitted during the regular admission process?
Answers: 3
Mathematics, 21.06.2019 21:30
Use the method of cylindrical shells to find the volume v generated by rotating the region bounded by the curves about the given axis.y = 7ex, y = 7e^-x, x = 1; about the y-axis
Answers: 2
Mathematics, 21.06.2019 23:30
In a study of the relationship between socio-economic class and unethical behavior, 129 university of california undergraduates at berkeley were asked to identify themselves as having low or high social-class by comparing themselves to others with the most (least) money, most (least) education, and most (least) respected jobs. they were also presented with a jar of individually wrapped candies and informed that the candies were for children in a nearby laboratory, but that they could take some if they wanted. after completing some unrelated tasks, participants reported the number of candies they had taken. it was found that those who were identiď¬ed as upper-class took more candy than others. in this study, identify: (a) the cases, (b) the variables and their types, (c) the main research question, (d) identify the population of interest and the sample in this study, and (e) comment on whether or not the results of the study can be generalized to the population, and if the ď¬ndings of the study can be used to establish causal relationships.
Answers: 2
You know the right answer?
The table shows the values of a function f (x), What is the average rate of change of f (x) over the...
Questions

History, 29.10.2019 10:31


Biology, 29.10.2019 10:31

Social Studies, 29.10.2019 10:31


Chemistry, 29.10.2019 10:31
Mathematics, 29.10.2019 10:31

Mathematics, 29.10.2019 10:31
Mathematics, 29.10.2019 10:31


