Math Graded asignUnit Test
SF
score for Question 2 of 5 points
2 Jolie manages an annua...

Mathematics, 08.04.2021 19:50 mnikitha07
Math Graded asignUnit Test
SF
score for Question 2 of 5 points
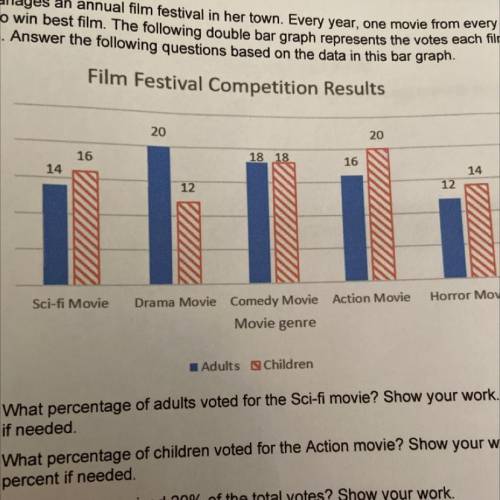
2 Jolie manages an annual film festval in her town. Every year, one movie from every genre is chosen as a
finalist to win best film The following double bar graph represents the votes each fim received by adults and
children Answer the following questions based on the data in this bar graph
Film Festival Competition Results
20
16
Number of votes
u 8 8 04
Horror Movie
Sci- Movie
Drama Movie Comedy Movie Action Movie
Movie genre
Adults Children
(a) What percentage of adults voted for the Sci-fi movie? Show your work. Round to the nearest percent
needed.
(b) What percentage of children voted the Action movie? Show your work. Round to the nearest
percent needed
(c) Which movie received 20% of the total votes? Show your work

Answers: 3


Another question on Mathematics
Mathematics, 21.06.2019 19:30
The position of a moving particle is given by the position function: f(t)=-9t-t^2-0.2t^3+0.1t^4 0 a. at what time does the particle reverse direction? b. when is the displacement positive? (round one decimal place and answer in interval notation) c. when is the displacement negative? (round one decimal place and answer in interval notation) d. when is the particle’s acceleration positive? (round one decimal place and answer in interval notation) e. when is the particle’s acceleration negative? (round one decimal place and answer in interval notation)
Answers: 3
Mathematics, 22.06.2019 01:30
Given are five observations for two variables, x and y. xi 1 2 3 4 5 yi 3 7 5 11 14 which of the following is a scatter diagrams accurately represents the data? what does the scatter diagram developed in part (a) indicate about the relationship between the two variables? try to approximate the relationship betwen x and y by drawing a straight line through the data. which of the following is a scatter diagrams accurately represents the data? develop the estimated regression equation by computing the values of b 0 and b 1 using equations (14.6) and (14.7) (to 1 decimal). = + x use the estimated regression equation to predict the value of y when x = 4 (to 1 decimal). =
Answers: 3
Mathematics, 22.06.2019 02:30
Find the slope of the line that passes through the points (-2, 4) and (-5, -6). -2/7 10/3 -2/3
Answers: 1
You know the right answer?
Questions

History, 15.10.2021 18:30

Social Studies, 15.10.2021 18:40

Advanced Placement (AP), 15.10.2021 18:50
Mathematics, 15.10.2021 18:50

English, 15.10.2021 19:00
Mathematics, 15.10.2021 19:10

Physics, 15.10.2021 19:10
History, 15.10.2021 19:20
Mathematics, 15.10.2021 19:20
Mathematics, 15.10.2021 19:30

Mathematics, 15.10.2021 19:30


