
Mathematics, 09.04.2021 04:10 cpadoc7567
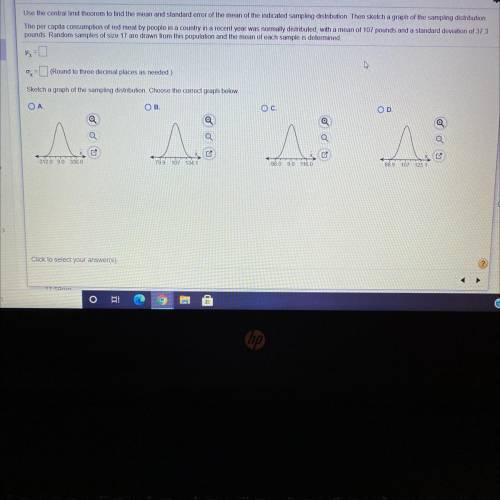
Use the Central Limit Theorem to find the mean and standard error of the mean of the indicated sampling distribution. Then sketch a graph of the sampling distribution. The per capita consumption of red meat by people in a country in a recent year was normally distributed, with a mean of 107 pounds and a standard deviation of 37.3 pounds. Random samples of size 17 are drawn from this population and the mean of each sample is determined.

Answers: 2


Another question on Mathematics
Mathematics, 21.06.2019 13:00
Which of the following system of equation is not equal to the system of equations is not equal to the system of equations shown below
Answers: 3
Mathematics, 21.06.2019 13:30
Adaylily farm sells a portion of their daylilies and allows a portion to grow and divide. the recursive formula an=1.5(an-1)-100 represents the number of daylilies, a, after n years. after the fifth year, the farmers estimate they have 2225 daylilies. how many daylilies were on the farm after the first year?
Answers: 2
Mathematics, 21.06.2019 13:40
Vip at (-2,7) dropped her pass and moved to the right on a slope of -9 where can you catch up to her to return her vip pass
Answers: 1
Mathematics, 21.06.2019 15:30
The coordinates of a, b, and c in the diagram are a(p,4), b(6,1), and c(9,q). which equation correctly relates p and q? hint: since is perpendicular to , the slope of × the slope of = -1. a. p - q = 7 b. q - p = 7 c. -q - p = 7 d. p + q = 7
Answers: 3
You know the right answer?
Use the Central Limit Theorem to find the mean and standard error of the mean of the indicated sampl...
Questions
Mathematics, 05.05.2020 15:03


Biology, 05.05.2020 15:03
Mathematics, 05.05.2020 15:03

Physics, 05.05.2020 15:03
Mathematics, 05.05.2020 15:03


Mathematics, 05.05.2020 15:03


