
Mathematics, 09.04.2021 20:50 lyn36
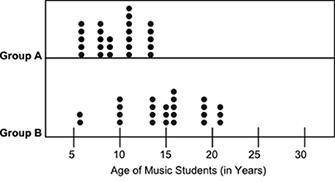
The dot plots below show the ages of students belonging to two groups of music classes: A dot plot shows two divisions labeled Group A and Group B. The horizontal axis is labeled as Age of Music Students in years. Group A shows 5 dots at 6, 5 dots at 8, 3 dots at 9, 7 dots at 11, and 5 dots at 13. Group B shows 2 dots at 6, 4 dots at 10, 4 dots at 13, 3 dots at 15, 5 dots at 16, 4 dots at 19, and 3 dots at 21. Based on visual inspection, which group most likely has a lower mean age of music students? Explain your answer using two or three sentences. Make sure to use facts to support your answer. (10 points)

Answers: 1


Another question on Mathematics
Mathematics, 21.06.2019 14:00
Question 3 of 30 paul buys fruit to make smoothies. he buys 3.78 pounds of apples, 2.12 pounds of peaches, and 4.45 pounds of oranges. paul rounds each weight to the nearest tenth of a pound. about how many pounds of fruit did paul buy? (a) 10.5 pounds (b) 10.2 pounds (c) 10.4 pounds (d) 10.0 pounds 30 points
Answers: 2
Mathematics, 21.06.2019 18:30
How do you create a data set with 8 points in it that has a mean of approximately 10 and a standard deviation of approximately 1?
Answers: 1
Mathematics, 21.06.2019 22:20
Which graph has figures that can undergo a similarity transformation to justify that they are similar? (obviously not the third one)
Answers: 2
You know the right answer?
The dot plots below show the ages of students belonging to two groups of music classes: A dot plot s...
Questions

Mathematics, 12.03.2021 14:00

Social Studies, 12.03.2021 14:00

Mathematics, 12.03.2021 14:00
Mathematics, 12.03.2021 14:00

Chemistry, 12.03.2021 14:00

Physics, 12.03.2021 14:00
Mathematics, 12.03.2021 14:00
Social Studies, 12.03.2021 14:00
Mathematics, 12.03.2021 14:00

Mathematics, 12.03.2021 14:00


