
Mathematics, 10.04.2021 05:00 marquez8
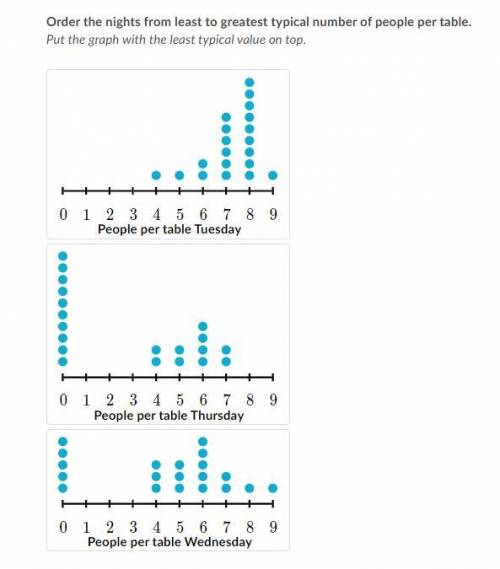
The following dot plots show the numbers of people per table at Kingsley's Bingo Hall on three different nights. Each dot represents one of the 20 tables.
Order the nights from least to greatest typical number of people per table.
Put the graph with the least typical value on top.

Answers: 1


Another question on Mathematics
Mathematics, 21.06.2019 17:40
The weight of full–grown tomatoes at a farm is modeled by a normal distribution with a standard deviation of 18.4 grams. the 95 percent confidence interval for the mean weight of the tomatoes is calculated using a sample of 100 tomatoes. what is the margin of error (half the width of the confidence interval)?
Answers: 2
Mathematics, 21.06.2019 19:30
Koji is installing a rectangular window in an office building. the window is 823 feet wide and 534 feet high. the formula for the area of a rectangle is a=bh. what is the area of the window? enter your answer as a mixed number in simplest form in the box. $$ ft2
Answers: 1
Mathematics, 21.06.2019 23:30
Written as a simplified polynomial in standard form, what is the result when (2x+8)^2(2x+8) 2 is subtracted from 8x^2-38x 2 −3?
Answers: 3
You know the right answer?
The following dot plots show the numbers of people per table at Kingsley's Bingo Hall on three diffe...
Questions


Spanish, 07.01.2020 10:31

Chemistry, 07.01.2020 10:31

History, 07.01.2020 10:31

Mathematics, 07.01.2020 10:31
Mathematics, 07.01.2020 10:31
Mathematics, 07.01.2020 10:31
History, 07.01.2020 10:31
Mathematics, 07.01.2020 10:31


Social Studies, 07.01.2020 10:31


