
Mathematics, 11.04.2021 18:40 nika0001
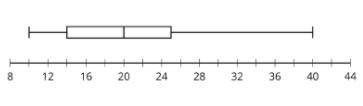
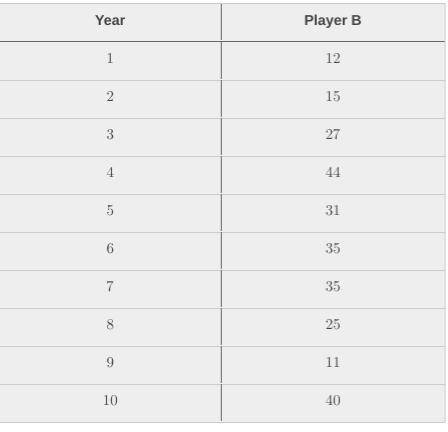
The box plot (Player A) and table (Player B) represent the number of goals scored in a season by two soccer players. If you were a coach of a soccer team, which player would you want on your team and why? Think about how consistency would be affected by IQR and range.

Answers: 1


Another question on Mathematics
Mathematics, 21.06.2019 19:00
Jack did 3/5 of all problems on his weekend homework before sunday. on sunday he solved 1/3 of what was left and the last 4 problems. how many problems were assigned for the weekend?
Answers: 1
Mathematics, 21.06.2019 20:50
Including 6% sales tax, an inn charges $135.68 per night. find the inns nightly cost
Answers: 1
Mathematics, 21.06.2019 21:00
If u good at math hit me up on insta or sum @basic_jaiden or @ and
Answers: 1
You know the right answer?
The box plot (Player A) and table (Player B) represent the number of goals scored in a season by two...
Questions


