
Mathematics, 12.04.2021 21:50 debramknoxx
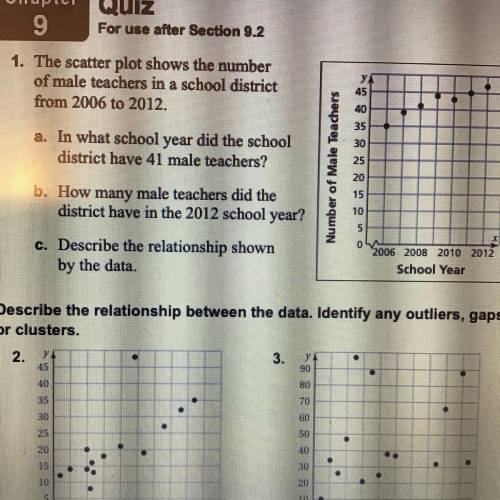
1. The scatterplot shows the number of male teachers in a school district from 2006 to 2012.
a. In what school year did the school district have 41 male teachers?
b. How many male teachers did the district have in the 2012 school year?
c. Describe the relationship shown by the data.

Answers: 1


Another question on Mathematics
Mathematics, 21.06.2019 12:30
Write the equation below the represents the line passing through the point (-3, -1) negative one with a slope of 4
Answers: 2
Mathematics, 21.06.2019 16:30
Astandard american eskimo dog has a mean weight of 30 pounds with a standard deviation of 2 pounds. assuming the weights of standard eskimo dogs are normally distributed, what range of weights would 99.7% of the dogs have? approximately 26–34 pounds approximately 24–36 pounds approximately 28–32 pounds approximately 29–31 pounds
Answers: 1
Mathematics, 21.06.2019 18:20
Choose all that apply. select all of the fees a credit card may have. annual fee apr balance transfer fee cash advance fee late fee overdraft fee over-the-limit fee
Answers: 2
You know the right answer?
1. The scatterplot shows the number of male teachers in a school district from 2006 to 2012.
a. In...
Questions

Social Studies, 08.10.2019 19:30

History, 08.10.2019 19:30


Mathematics, 08.10.2019 19:30
Social Studies, 08.10.2019 19:30
Mathematics, 08.10.2019 19:30
Mathematics, 08.10.2019 19:30


Advanced Placement (AP), 08.10.2019 19:30

Spanish, 08.10.2019 19:30
History, 08.10.2019 19:30


