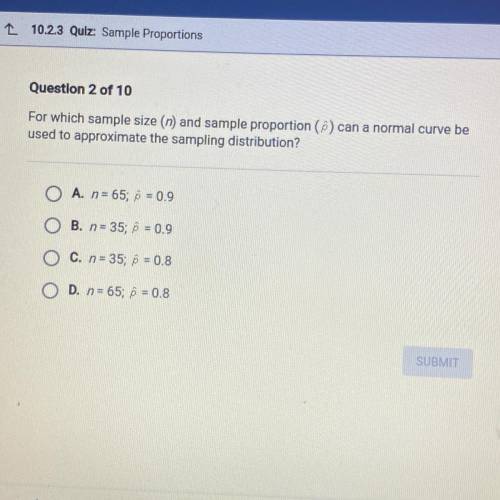
Question 2 of 10
For which sample size (n) and sample proportion () can a normal curve be
use...

Mathematics, 12.04.2021 23:20 sukhmanksidhu
Question 2 of 10
For which sample size (n) and sample proportion () can a normal curve be
used to approximate the sampling distribution?
A. n = 65; p = 0.9
O B. n = 35; p = 0.9
C. n = 35; p = 0.8
O D. n = 65; 6 = 0.8


Answers: 1


Another question on Mathematics

Mathematics, 21.06.2019 21:00
Type the correct answer in each box. use numerals instead of words. if necessary, use / fir the fraction bar(s). the graph represents the piecewise function: h
Answers: 3

Mathematics, 21.06.2019 21:00
Deepak plotted these points on the number line. point a: –0.3 point b: – 3 4 point c: – 11 4 point d: –0.7 which point did he plot incorrectly?
Answers: 2

Mathematics, 21.06.2019 23:40
The function f(x)= -(x+5)(x+1) is down. what is the range of the function?
Answers: 3

Mathematics, 22.06.2019 03:20
What is the volume of a cardboard box that measures 1 inch by 5 inches by 7 inches? the volume of the cardboard is cubic inches. enter your answer as the number that correctly fills in the blank in the previous sentence. if necessary, round your answer to the nearest tenth, like this: 42.5
Answers: 1
You know the right answer?
Questions


Mathematics, 31.08.2019 17:10


Mathematics, 31.08.2019 17:10


Chemistry, 31.08.2019 17:10


Biology, 31.08.2019 17:10

Mathematics, 31.08.2019 17:10


Biology, 31.08.2019 17:10


History, 31.08.2019 17:10


