
Which values should you plot to show a linear relationship?
Month Population
Log(population)<...

Mathematics, 13.04.2021 03:10 juniorgutierrez997
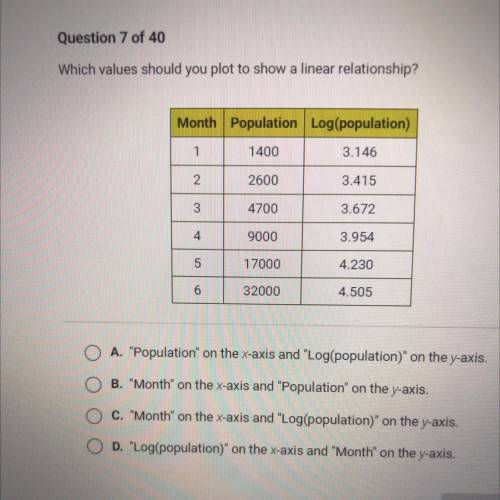
Which values should you plot to show a linear relationship?
Month Population
Log(population)
1
1400
3.146
2
2600
3.415
3
4700
3.672
4
9000
3.954
5
17000
4.230
6
32000
4.505
O A. "Population on the x-axis and "Log(population)" on the y-axis.
O B. "Month" on the x-axis and "Population" on the y-axis.
w
O C. "Month" on the x-axis and "Log(population)" on the y-axis.
O D. "Log(population)" on the x-axis and "Month" on the y-axis.

Answers: 2


Another question on Mathematics
Mathematics, 21.06.2019 13:10
Next, chad created this graph with ordered pairs that show the possible ratios of the number of damage to defense cards in his deck.what error chad make?
Answers: 1
Mathematics, 21.06.2019 14:30
Given the parent function of [tex]f(x)=x^4[/tex], what change will occur when the function is changed to [tex]f(\frac{1}{2} x)[/tex]?
Answers: 3
Mathematics, 21.06.2019 17:30
The following frequency table relates the weekly sales of bicycles at a given store over a 42-week period.value01234567frequency367108521(a) in how many weeks were at least 2 bikes sold? (b) in how many weeks were at least 5 bikes sold? (c) in how many weeks were an even number of bikes sold?
Answers: 2
Mathematics, 21.06.2019 19:00
The liabilities of cullumber are $99,000. owner’s capital is $143,000; drawings are $96,000; revenues, $467,000; and expenses, $301,000. what is the amount of cullumber company’s total assists?
Answers: 1
You know the right answer?
Questions


Mathematics, 19.06.2020 04:57
Mathematics, 19.06.2020 04:57
Mathematics, 19.06.2020 04:57

Biology, 19.06.2020 04:57
Mathematics, 19.06.2020 04:57
Mathematics, 19.06.2020 04:57


