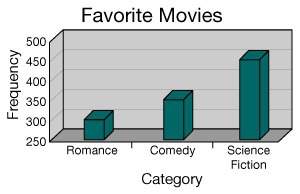
Choose the most accurate statement based on the graph shown.
the graph is a good represe...

Mathematics, 06.10.2019 10:01 delgadillogiselle711
Choose the most accurate statement based on the graph shown.
the graph is a good representation of the data.
the graph is misleading because it uses 3-dimensional bars.
the graph is misleading because the vertical range is too small creating the impression that differences are greater than they actually are.

Answers: 2


Another question on Mathematics
Mathematics, 21.06.2019 16:00
Find the equation of the trend line (line of best fit). show your work i'm using the points (34,76) (42,91)
Answers: 2
Mathematics, 21.06.2019 18:30
Which equation represents the model shown? a)1/3 divide 1/6 = 2 b)2/3 divide 1/6 = 2/18 c)1/3 divide 1/6 = 1/18 d)2/3 divide 1/6 =4
Answers: 1
Mathematics, 21.06.2019 22:30
What is the point of inflection for the function f(x)=2cos4x on the interval (0, pi/2)
Answers: 2
Mathematics, 22.06.2019 00:30
Anew test for ra is being developed. the test is administered to 750 patients with ra and 750 without ra. for the sake of the question, assume the prevalence of ra in this population is 50%. of the 750 patients with ra, 575 have a positive result. of the 750 patients without ra, 150 have a positive result. what is the positive predictive value of the new test? a575/(575+150) b. 600/(600+ 150) c. 575/(575+125) d. 600/(600+ 125)
Answers: 2
You know the right answer?
Questions

Mathematics, 11.03.2020 04:43

Mathematics, 11.03.2020 04:43

Mathematics, 11.03.2020 04:43
Mathematics, 11.03.2020 04:43

Chemistry, 11.03.2020 04:43
Mathematics, 11.03.2020 04:43
Mathematics, 11.03.2020 04:43
Biology, 11.03.2020 04:43
Mathematics, 11.03.2020 04:43


History, 11.03.2020 04:43
Mathematics, 11.03.2020 04:43

English, 11.03.2020 04:43
Physics, 11.03.2020 04:43


