
Mathematics, 13.04.2021 23:20 jaceraulerson7249
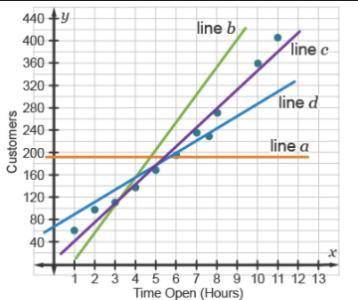
The scatterplot contains data points, showing the number of hours a coffee shop is open (x) and the number of customers served (y).
A graph with time open (hours) on the x-axis and customers on the y-axis. Line c is the line of best fit.
Using the least-squares regression method, which is the line of best fit?
line a
line b
line c
line d

Answers: 3


Another question on Mathematics
Mathematics, 21.06.2019 19:00
Rob spent 25%, percent more time on his research project than he had planned. he spent an extra h hours on the project. which of the following expressions could represent the number of hours rob actually spent on the project? two answers
Answers: 1
Mathematics, 21.06.2019 19:20
Will give brainliest immeadeately true or false: the origin woud be included in the solution set for the inequality: y< 2x-5
Answers: 1
Mathematics, 21.06.2019 20:00
Compare the following pair of numbers a and b in three ways. a. find the ratio of a to b. b. find the ratio of b to a. c. complete the sentence: a is percent of b. a=120 and b=340 a. the ratio of a to b is . b. the ratio of b to a is . c. a is nothing percent of b.
Answers: 1
Mathematics, 21.06.2019 21:00
Rewrite the following quadratic functions in intercept or factored form. show your work. y = x^2 + 7x + 10
Answers: 2
You know the right answer?
The scatterplot contains data points, showing the number of hours a coffee shop is open (x) and the...
Questions


Social Studies, 06.12.2021 22:30

Social Studies, 06.12.2021 22:30

English, 06.12.2021 22:30


Geography, 06.12.2021 22:30

English, 06.12.2021 22:30
Mathematics, 06.12.2021 22:30
Mathematics, 06.12.2021 22:30

Computers and Technology, 06.12.2021 22:30
Social Studies, 06.12.2021 22:30


