Which equation matches the graph shown below?
y = 8x² + 2x – 5
y = 8x² + 2x + 5
y...

Mathematics, 16.09.2019 14:30 timothyallenhall2006
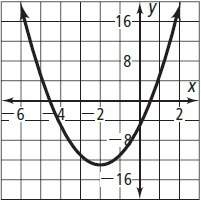
Which equation matches the graph shown below?
y = 8x² + 2x – 5
y = 8x² + 2x + 5
y = 2x² + 8x + 5
y = 2x² + 8x – 5

Answers: 1


Another question on Mathematics
Mathematics, 21.06.2019 19:30
Cor d? ? me ? max recorded the heights of 500 male humans. he found that the heights were normally distributed around a mean of 177 centimeters. which statements about max’s data must be true? a) the median of max’s data is 250 b) more than half of the data points max recorded were 177 centimeters. c) a data point chosen at random is as likely to be above the mean as it is to be below the mean. d) every height within three standard deviations of the mean is equally likely to be chosen if a data point is selected at random.
Answers: 1
Mathematics, 21.06.2019 20:00
How to find the exponential function y=ca^x, with points (1,2) and (2,1)
Answers: 2
Mathematics, 21.06.2019 20:00
15m is what percent of 60m; 3m; 30m; 1.5 km? the last one is km not m
Answers: 1
Mathematics, 21.06.2019 23:00
Someone answer this asap for the first five terms of a sequence are shown. 5, 11, 23, 47, 95, . . which recursive function defines the nth term in the sequence for n > 1? a. f(n) = f(n - 1) + 6 b) f(n) = f(n - 1) + 48 c) f(n) = 3 • f(n - 1) + 1 d) f(n) = 3 • f(n - 1) - 4
Answers: 1
You know the right answer?
Questions


Mathematics, 18.10.2019 10:10

Social Studies, 18.10.2019 10:10

Arts, 18.10.2019 10:10

Geography, 18.10.2019 10:10
Mathematics, 18.10.2019 10:10

History, 18.10.2019 10:10
Mathematics, 18.10.2019 10:10
Mathematics, 18.10.2019 10:10
History, 18.10.2019 10:10


