
Mathematics, 14.04.2021 18:40 kp328
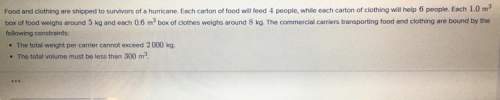
Using data from a recent study, Jack prepared a scatter plot and created a best fit line, as shown below. Melani said that the best fit line was incorrect because the data had a positive association. Danesha said that the best fit line was incorrect because, while the data had a negative association, his slope was way off. Krystal said that the best fit line was incorrect because he just connected 2 points from the data and did not draw it so that it was as close to all of the points as possible. Who was right?
A
Jack
B
Melani
C
Danesha
D
Krystal

Answers: 2


Another question on Mathematics
Mathematics, 21.06.2019 17:00
Which measure is equivalent to 110 ml? 0.0110 l 0.110 l 1.10 l 11,000 l
Answers: 2
Mathematics, 21.06.2019 21:00
God's gym charges a sign-up fee of $100 plus $30 per month. write an expression to represent how much someone would pay for a membership.
Answers: 1
Mathematics, 22.06.2019 00:20
Convert the number to decimal form. 12) 312five a) 82 b) 30 c) 410 d) 1560 13) 156eight a) 880 b) 96 c) 164 d) 110 14) 6715eight a) 53,720 b) 3533 c) 117 d) 152
Answers: 1
You know the right answer?
Using data from a recent study, Jack prepared a scatter plot and created a best fit line, as shown b...
Questions
Mathematics, 18.06.2021 17:10

Mathematics, 18.06.2021 17:10
Mathematics, 18.06.2021 17:10

Mathematics, 18.06.2021 17:20
Mathematics, 18.06.2021 17:20
Physics, 18.06.2021 17:20


Mathematics, 18.06.2021 17:20
Mathematics, 18.06.2021 17:20


