
Mathematics, 14.04.2021 19:40 axelsanchez7710
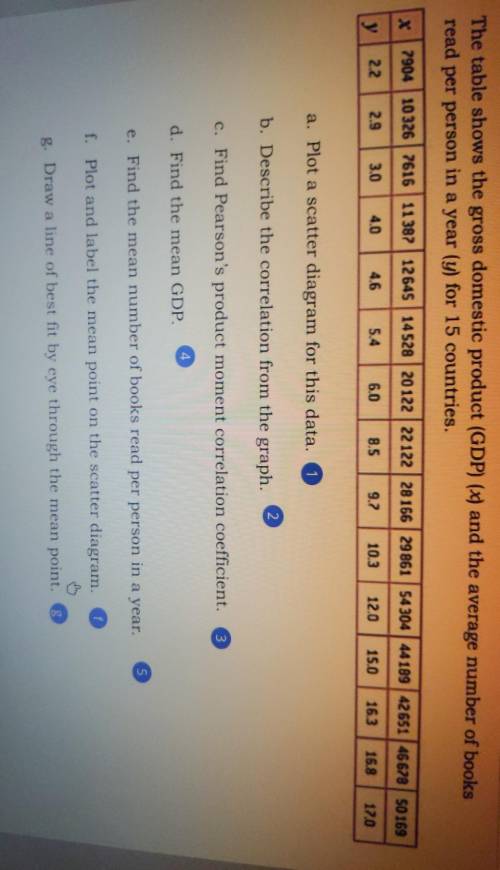
The table shows the gross domestic product (GDP) (x) and the average number of books read per person in a year (y) for 15 countries.
a. Plot a scatter diagram for this data.
b. Describe the correlation from the graph.
c. Find Pearson's product moment correlation coefficient.
d. Find the mean GDP.
e. Find the mean number of books read per person in a year. 5
f. Plot and label the mean point on the scatter diagram.
g. Draw a line of best fit by eye through the mean point.

Answers: 1


Another question on Mathematics
Mathematics, 21.06.2019 16:00
When turned about its axis of rotation, which shape could have created this three-dimensional object?
Answers: 3
Mathematics, 21.06.2019 17:30
Sheila wants to bake six muffins but the recipe is for 12 muffins . this means you only need half of the ingredients listed how much of the of each ingredient does she need? one cup and banana chips ,7 tablespoons oil , two eggs, 3/4 cups flour 1/4 cup walnuts show all you work and justify your answer using a baby toulmin.
Answers: 3
Mathematics, 21.06.2019 18:30
Mr. and mrs. wallace have decided to buy a car for $21,600. they finance $15,000 of it with a 5-year auto loan at 2.9% arp. what will be their monthly payment be? a. $268.20 b. $268.86 c. $269.54 d. $387.16 (monthly car loan payment per $1,000 borrowed) i need !
Answers: 1
You know the right answer?
The table shows the gross domestic product (GDP) (x) and the average number of books read per person...
Questions

Biology, 18.01.2020 03:31
Mathematics, 18.01.2020 03:31


Spanish, 18.01.2020 03:31

History, 18.01.2020 03:31

Social Studies, 18.01.2020 03:31
Mathematics, 18.01.2020 03:31
Mathematics, 18.01.2020 03:31
Mathematics, 18.01.2020 03:31
Mathematics, 18.01.2020 03:31

Chemistry, 18.01.2020 03:31
Biology, 18.01.2020 03:31
Business, 18.01.2020 03:31

Mathematics, 18.01.2020 03:31


