
Mathematics, 14.04.2021 20:40 cee837
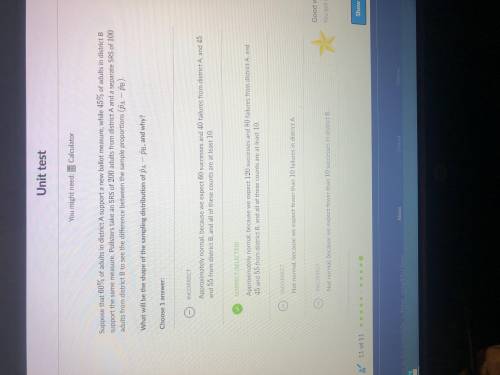
Suppose that 60\%60%60, percent of adults in district A support a new ballot measure, while 45\%45%45, percent of adults in district B support the same measure. Pollsters take an SRS of 200200200 adults from district A and a separate SRS of 100100100 adults from district B to see the difference between the sample proportions (\hat{p}_\text{A}-\hat{p}_\text{B}) ( p ^ A − p ^ B )left parenthesis, p, with, hat, on top, start subscript, start text, A, end text, end subscript, minus, p, with, hat, on top, start subscript, start text, B, end text, end subscript, right parenthesis. What will be the shape of the sampling distribution of \hat{p}_\text{A}-\hat{p}_\text{B} p ^ A − p ^ B p, with, hat, on top, start subscript, start text, A, end text, end subscript, minus, p, with, hat, on top, start subscript, start text, B, end text, end subscript, and why?

Answers: 2


Another question on Mathematics
Mathematics, 21.06.2019 17:50
The length and width of a rectangle are consecutive even integers the area of the rectangle is 120 squares units what are the length and width of the rectangle
Answers: 1
Mathematics, 21.06.2019 19:10
1jessica's home town is a mid-sized city experiencing a decline in population. the following graph models the estimated population if the decline continues at the same rate. select the most appropriate unit for the measure of time that the graph represents. a. years b. hours c. days d. weeks
Answers: 2
Mathematics, 22.06.2019 02:00
The trapezoid is composed of a rectangle and two triangles. what is the area of the rectangle? what is the total area of the triangles? what is the area of the trapezoid? a) 48 cm2; 32 cm2; 80 cm 2 b) 48 cm2; 16 cm2; 64 cm 2 c) 128 cm2; 32 cm2; 160 cm 2 d) 128 cm2; 16 cm2; 144 cm 2
Answers: 1
Mathematics, 22.06.2019 02:30
Atrain traveled for 1.5 hours to the first station, stopped for 30 minutes, then traveled for 4 hours to the final station where it stopped for 1 hour. the total distance traveled is a function of time. which graph most accurately represents this scenario? a graph is shown with the x-axis labeled time (in hours) and the y-axis labeled total distance (in miles). the line begins at the origin and moves upward for 1.5 hours. the line then continues upward at a slow rate until 2 hours. from 2 to 6 hours, the line continues quickly upward. from 6 to 7 hours, it moves downward until it touches the x-axis a graph is shown with the axis labeled time (in hours) and the y axis labeled total distance (in miles). a line is shown beginning at the origin. the line moves upward until 1.5 hours, then is a horizontal line until 2 hours. the line moves quickly upward again until 6 hours, and then is horizontal until 7 hours a graph is shown with the axis labeled time (in hours) and the y-axis labeled total distance (in miles). the line begins at the y-axis where y equals 125. it is horizontal until 1.5 hours, then moves downward until 2 hours where it touches the x-axis. the line moves upward until 6 hours and then moves downward until 7 hours where it touches the x-axis a graph is shown with the axis labeled time (in hours) and the y-axis labeled total distance (in miles). the line begins at y equals 125 and is horizontal for 1.5 hours. the line moves downward until 2 hours, then back up until 5.5 hours. the line is horizontal from 5.5 to 7 hours
Answers: 1
You know the right answer?
Suppose that 60\%60%60, percent of adults in district A support a new ballot measure, while 45\%45%4...
Questions
Mathematics, 07.10.2020 14:01


Arts, 07.10.2020 14:01

Mathematics, 07.10.2020 14:01
Mathematics, 07.10.2020 14:01
Mathematics, 07.10.2020 14:01
Mathematics, 07.10.2020 14:01

Advanced Placement (AP), 07.10.2020 14:01

Mathematics, 07.10.2020 14:01


