
Mathematics, 15.04.2021 01:00 teamroper35
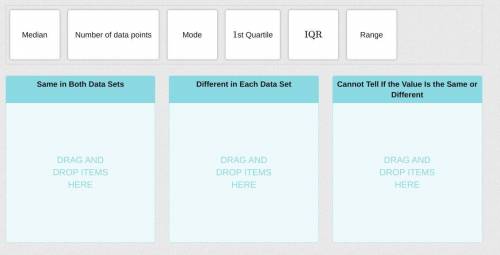
The box plots shown represent two data sets. Use the box plots to compare the data sets. Drag each value to show if it is the same for both data sets, different for each data set, or if there is not enough information to tell.


Answers: 1


Another question on Mathematics
Mathematics, 21.06.2019 19:40
The owners of four companies competing for a contract are shown in the table below. if a report is released that advocates company b, which of the people having funded the report should result in the most skepticism? company owner of company company a jake adams company b company c company d debby smith henry rose rhonda baker o a. jake adams o b. rhonda baker o c. debby smith o d. henry rose
Answers: 2
Mathematics, 21.06.2019 21:40
If angle b measures 25°, what is the approximate perimeter of the triangle below? 10.3 units 11.8 units 22.1 units 25.2 units
Answers: 2
Mathematics, 21.06.2019 23:50
Astudent draws two parabolas both parabolas cross the x axis at (-4,0) and (6,0) the y intercept of the first parabolas is (0,-12). the y intercept of the second parabola is (0,-24) what is the positive difference between the a values for the two functions that describe the parabolas
Answers: 3
You know the right answer?
The box plots shown represent two data sets. Use the box plots to compare the data sets. Drag each v...
Questions


History, 05.03.2020 08:11


Mathematics, 05.03.2020 08:13
Chemistry, 05.03.2020 08:13


Chemistry, 05.03.2020 08:13


