
Mathematics, 15.04.2021 07:10 dlo2457
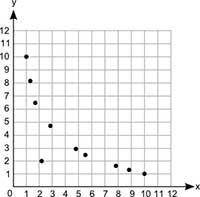
What type of association does the graph show between x and y? (5 points)
A graph shows scale on x axis and y axis from 0 to 12 at increments of 1. Dots are made at ordered pairs 1, 10 and 1.2, 8.1and 1.7, 6.5 and 2.2, 2.2 and 2.9, 4.8 and 4.9, 3 and 5.5, 2.5 and 7.7,1.3 and 8.8, 1.1 and 10, 1.
Linear positive association
Nonlinear positive association
Linear negative association
Nonlinear negative association

Answers: 3


Another question on Mathematics
Mathematics, 21.06.2019 16:30
Its due ! write an equation in which the quadratic expression 2x^2-2x 12 equals 0. show the expression in factored form and explain what your solutions mean for the equation. show your work.
Answers: 1
Mathematics, 21.06.2019 18:00
In the polynomial below, what number should replace the question mark to produce a difference of squares? x2 + ? x - 36
Answers: 3
Mathematics, 22.06.2019 01:30
If a sprinkler waters 1 over 12 of a lawn in 1 over 2 hour, how much time will it take to water the entire lawn? (5 points) 10 hours 6 hours 1 over 6 hour 7 over 12 hour
Answers: 1
Mathematics, 22.06.2019 02:30
Abby is collecting rainfall data. she finds that one value of the data set is a high-value outlier. which statement must be true? abby will use a different formula for calculating the standard deviation. the outlier will increase the standard deviation of the data set. the spread of the graph of the data will not change. abby will not use the mean when calculating the standard deviation.
Answers: 3
You know the right answer?
What type of association does the graph show between x and y? (5 points)
A graph shows scale on x a...
Questions

History, 21.04.2020 22:42
Mathematics, 21.04.2020 22:42


Mathematics, 21.04.2020 22:43
Mathematics, 21.04.2020 22:43

Mathematics, 21.04.2020 22:43
Mathematics, 21.04.2020 22:43

History, 21.04.2020 22:43


