
Mathematics, 15.04.2021 18:20 fluffy37
Question 3
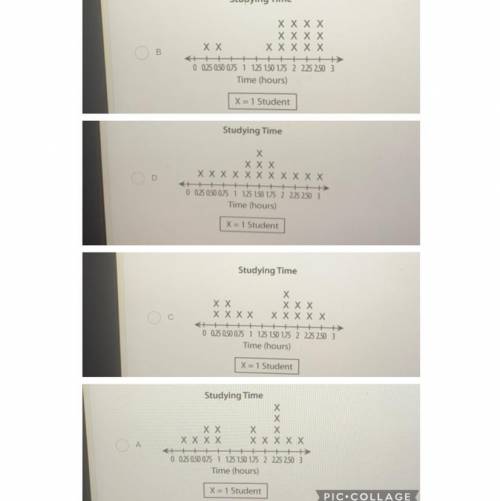
Sam conducted a survey at lunchtime to find the number of hours that students spent studying for the science test. He asked 15 different students how much time they spent studying. Sam drew
a line plot of the data. His plot has a spread of 2.25 and peaks at 1.75 hours. Which graph line plot did Sam draw?
Studying Time

Answers: 1


Another question on Mathematics
Mathematics, 21.06.2019 14:30
The perimiter of a rectangle is 70 inches the legneth of the rectangle is 5 less than 3 times the width of the rectangle what is the width of the rectangle
Answers: 3
Mathematics, 21.06.2019 17:30
Is appreciated! graph the functions and approximate an x-value in which the exponential function surpasses the polynomial function. f(x) = 4^xg(x) = 4x^2options: x = -1x = 0x = 1x = 2
Answers: 1
Mathematics, 21.06.2019 19:30
Write the expression 7x^3-28xy^2 as the product of 3 factors
Answers: 2
Mathematics, 21.06.2019 20:30
Janet is rolling a number cube with the numbers one through six she record the numbers after each row if she rolls of keep 48 times how many times should she expect to roll a 4
Answers: 1
You know the right answer?
Question 3
Sam conducted a survey at lunchtime to find the number of hours that students spent stud...
Questions

Mathematics, 09.10.2021 19:40
Mathematics, 09.10.2021 19:50

History, 09.10.2021 19:50
Mathematics, 09.10.2021 19:50

Geography, 09.10.2021 19:50

History, 09.10.2021 19:50
Mathematics, 09.10.2021 19:50

Geography, 09.10.2021 19:50
Mathematics, 09.10.2021 19:50

Chemistry, 09.10.2021 19:50


