
Mathematics, 16.04.2021 16:40 Usman458
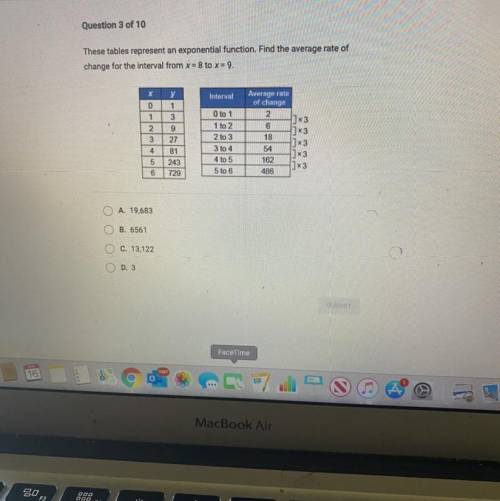
These tables represent an exponential function. Find the average rate of
change for the interval from x = 8 to x = 9.
х
Interval
0
1
2
3
y
1
3
9
27
81
243
729
O to 1
1 to 2
2 to 3
3 to 4
4 to 5
5 to 6
Average rate
of change
2
|]x3
6
]*3
18
]x3
54
3x3
162
| x3
486
4
5
6
O A. 19,683
B. 6561
O C. 13,122
D. 3

Answers: 2


Another question on Mathematics
Mathematics, 20.06.2019 18:02
Ineed with 14, 16, 28 and 36 me. we didn't go over them in class so i don't know what to do.
Answers: 1
Mathematics, 21.06.2019 18:50
Which translation maps the vertex of the graph of the function f(x) = x2 onto the vertex of the function g(x) = x2 – 10x +2?
Answers: 1
You know the right answer?
These tables represent an exponential function. Find the average rate of
change for the interval fr...
Questions


Arts, 20.07.2019 22:50

Physics, 20.07.2019 22:50
Mathematics, 20.07.2019 22:50

History, 20.07.2019 22:50

Chemistry, 20.07.2019 22:50
Mathematics, 20.07.2019 22:50
History, 20.07.2019 22:50
Biology, 20.07.2019 22:50
History, 20.07.2019 22:50


Social Studies, 20.07.2019 22:50

Geography, 20.07.2019 22:50

Physics, 20.07.2019 22:50


