
Mathematics, 16.04.2021 18:40 kelsey152
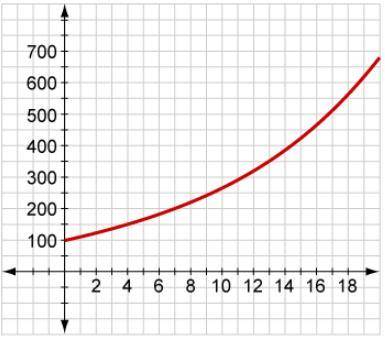
Which of the following scenarios is the best fit for the graph?
A. The value of a $100 stock grows in value by 10% each year.
B. The batting average of a baseball team increases by 50 points each year.
C. The population of a small town decreases by 10% each year.
D. A class's percent correct on a standardized Algebra I test increases after using a new software program.

Answers: 3


Another question on Mathematics
Mathematics, 21.06.2019 18:30
The base of a triangle exceeds the height by 9 inches. if the area is 180 square inches, find the length of the base and the height of the triangle.
Answers: 1
Mathematics, 21.06.2019 20:00
True or false: the graph of y=f(bx) is a horizontal compression of the graph y=f(x) if b< 1
Answers: 2
Mathematics, 21.06.2019 23:00
If i purchase a product for $79.99 and two accessories for 9.99 and 7.00 how much will i owe after taxes applies 8.75%
Answers: 2
You know the right answer?
Which of the following scenarios is the best fit for the graph?
A. The value of a $100 stock grows...
Questions


Physics, 26.01.2022 19:30


English, 26.01.2022 19:30
Mathematics, 26.01.2022 19:40
Mathematics, 26.01.2022 19:40
Mathematics, 26.01.2022 19:40
Mathematics, 26.01.2022 19:40
Mathematics, 26.01.2022 19:40

Biology, 26.01.2022 19:40


