
37
Entry Ticket
The dot plot shows the number of touchdowns a football team scored in 10 game...

Mathematics, 16.04.2021 22:20 mikisims
37
Entry Ticket
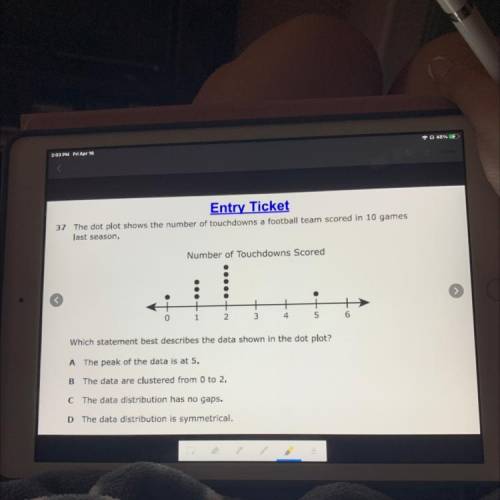
The dot plot shows the number of touchdowns a football team scored in 10 games
last season,
Number of Touchdowns Scored
0
1
2.
3
4
5
6
Which statement best describes the data shown in the dot plot?
A The peak of the data is at 5.
B The data are clustered from 0 to 2,
C The data distribution has no gaps.
D The data distribution is symmetrical.

Answers: 1


Another question on Mathematics
Mathematics, 21.06.2019 17:30
One integer is 8 times another. if the product is 72, then find the integers
Answers: 2
Mathematics, 21.06.2019 19:10
Alogical argument that is presented in graphical form using boxes and arrows is called?
Answers: 1
Mathematics, 21.06.2019 21:00
The zoo collects $9.60 for every 24 tickets sold. how much will be collected for 400 tickets?
Answers: 2
Mathematics, 21.06.2019 21:00
Solve this problem! extra ! 3025/5.5 = a/90.75 / = fraction
Answers: 3
You know the right answer?
Questions


History, 20.01.2021 22:30
Mathematics, 20.01.2021 22:30


Mathematics, 20.01.2021 22:30
History, 20.01.2021 22:30
Mathematics, 20.01.2021 22:30

Spanish, 20.01.2021 22:30

Biology, 20.01.2021 22:30
Mathematics, 20.01.2021 22:30


