
Mathematics, 17.04.2021 14:00 paulagarza
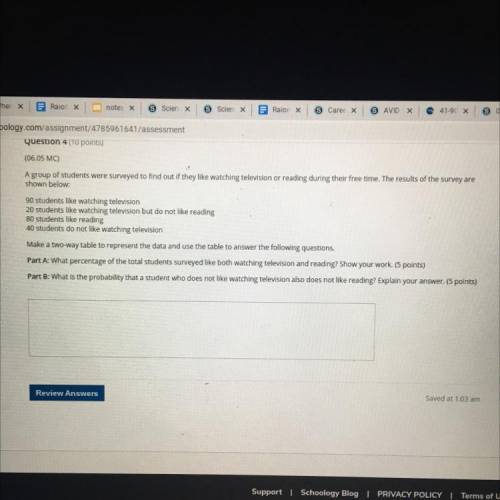
A group of students were surveyed to find out if they like watching television or reading during their free time. The results of the survey are
shown below:
90 students like watching television
20 students like watching television but do not like reading
80 students like reading
40 students do not like watching television
Make a two-way table to represent the data and use the table to answer the following questions,
Part A: What percentage of the total students surveyed like both watching television and reading? Show your work.
Part B: What is the probability that a student who does not like watching television also does not like reading? Explain your answer.

Answers: 3


Another question on Mathematics
Mathematics, 21.06.2019 16:20
Taking algebra two apex courses and need with these questions
Answers: 1
Mathematics, 21.06.2019 19:00
Atriangle has a side lengths of 18cm, 80 cm and 81cm. classify it as acute obtuse or right?
Answers: 2
Mathematics, 21.06.2019 20:30
The areas of two similar triangles are 72dm2 and 50dm2. the sum of their perimeters is 226dm. what is the perimeter of each of these triangles?
Answers: 1
Mathematics, 21.06.2019 23:30
Fill in the table with whole numbers to make 430 in five different ways
Answers: 1
You know the right answer?
A group of students were surveyed to find out if they like watching television or reading during the...
Questions
Mathematics, 12.10.2020 16:01

Business, 12.10.2020 16:01
Mathematics, 12.10.2020 16:01

Chemistry, 12.10.2020 16:01
Mathematics, 12.10.2020 16:01
Mathematics, 12.10.2020 16:01
Mathematics, 12.10.2020 16:01


Mathematics, 12.10.2020 16:01
Mathematics, 12.10.2020 16:01

Mathematics, 12.10.2020 16:01
Mathematics, 12.10.2020 16:01
Mathematics, 12.10.2020 16:01
Mathematics, 12.10.2020 16:01
Mathematics, 12.10.2020 16:01


