
Mathematics, 17.04.2021 17:20 tiarabivens0
Derive a mathematical model for water balance in the Great Lakes.
Your model should be realistic, but as simple as possible. This means that the best way to
start this problem is to model the water balance of one of the lakes. This initial model will
give you a standard of how to model the full network.
Water balance in a lake can be expressed as
dV
= flow in - flow out
dt
You only need include the most significant inflows/outflows of water for each lake
individually, as listed in the project brief and in the data attached. You should then aim to
solve your equations in a way where you can estimate the change in lake volume as a
function of time.
Try to state the most important physical assumptions in your model, briefly commenting on
how they might affect your final results.
.
Example of an assumption where you use data to simplify the solution
of your model
If a key quantity in your model only changes significantly every year, you might be
able to assume that the daily our hourly changes are too small to be meaningful for
your results and use a time step of one year.
Example of a limitation in your model that might be caused by data
If you only have access to average monthly data on a quantity that seems to change
daily, your model will probably be good at timescales of years, limited at timescales
of months, and meaningless at timescales of days.
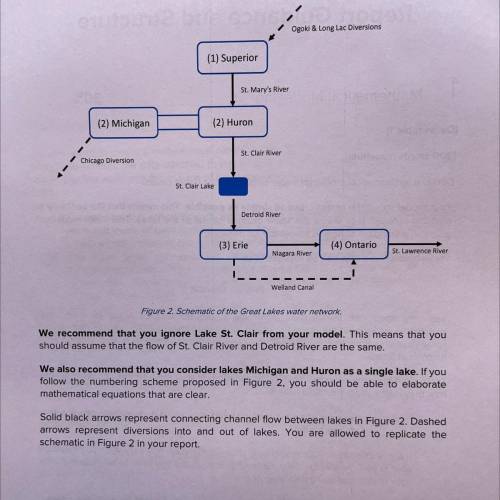
Use the following schematic to inform your modelling of the lake network.

Answers: 2


Another question on Mathematics
Mathematics, 21.06.2019 16:00
Which graph represents the solution set for the given system of inequalities? x+2y< 3 x+y> 4 3x-2y> 4
Answers: 2
Mathematics, 21.06.2019 19:40
It appears that people who are mildly obese are less active than leaner people. one study looked at the average number of minutes per day that people spend standing or walking. among mildly obese people, the mean number of minutes of daily activity (standing or walking) is approximately normally distributed with mean 376 minutes and standard deviation 64 minutes. the mean number of minutes of daily activity for lean people is approximately normally distributed with mean 528 minutes and standard deviation 107 minutes. a researcher records the minutes of activity for an srs of 7 mildly obese people and an srs of 7 lean people. use z-scores rounded to two decimal places to answer the following: what is the probability (image for it appears that people who are mildly obese are less active than leaner people. one study looked at the averag0.0001) that the mean number of minutes of daily activity of the 6 mildly obese people exceeds 420 minutes? what is the probability (image for it appears that people who are mildly obese are less active than leaner people. one study looked at the averag0.0001) that the mean number of minutes of daily activity of the 6 lean people exceeds 420 minutes?
Answers: 1
Mathematics, 21.06.2019 22:30
Which of the following graphs could represent a quartic function?
Answers: 1
Mathematics, 21.06.2019 22:50
Which of the following is closest to 32.9 x 7.5? a: 232 b: 259 c: 220 d: 265
Answers: 2
You know the right answer?
Derive a mathematical model for water balance in the Great Lakes.
Your model should be realistic, b...
Questions

Mathematics, 27.02.2020 07:37
Mathematics, 27.02.2020 07:38
Mathematics, 27.02.2020 07:38
Mathematics, 27.02.2020 07:38
English, 27.02.2020 07:38

Law, 27.02.2020 07:38
Mathematics, 27.02.2020 07:38
Mathematics, 27.02.2020 07:38
English, 27.02.2020 07:38

History, 27.02.2020 07:38
History, 27.02.2020 07:38
History, 27.02.2020 07:38
Mathematics, 27.02.2020 07:39

Physics, 27.02.2020 07:39
English, 27.02.2020 07:39
Mathematics, 27.02.2020 07:39
Mathematics, 27.02.2020 07:39
History, 27.02.2020 07:39


