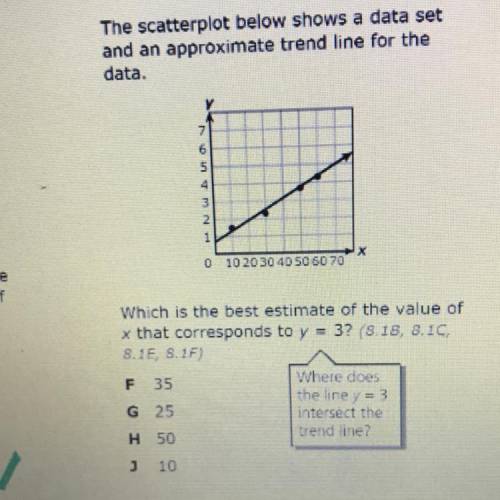
The scatterplot below shows a data set
and an approximate trend line for the
data.
7
6
5
3
1
0 10 20 30 40 50 60 70
Which is the best estimate of the value of
x that corresponds to y = 3? (8.18, 8.10,
SIE, SIF)
Where does
F 35
the line y = 3
G 25
intersect the
trend ine?
H 50
10
Tyler reads 2/5 of a book on monday, 1/3 of it on tuesday, 2/9 of it on wednesday, and 3/4 of the remainder on thursday. if he still has 14 pages left to read on friday, how many pages are there in the book?
No commitments. Cancel anytime. All pricing is in US dollars (USD). The subscriptoin renews automaticaly until you cancel. For more information read our Terms of use & Privacy Policy