B. x ≤ 2

Mathematics, 18.04.2021 14:00 jahnoibenjamin
Choose the inequality that represents the following graph
A. x < 2
B. x ≤ 2
C. x > 2
D. x ≥ 2
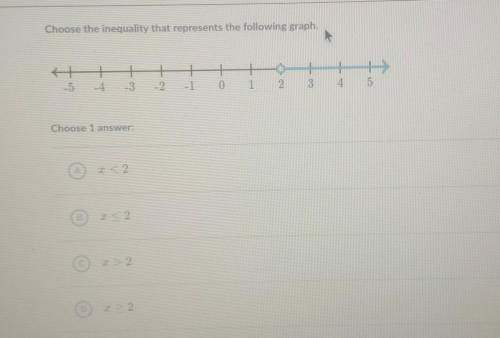

Answers: 2


Another question on Mathematics
Mathematics, 21.06.2019 18:00
The brain volumes (cm cubed) of 50 brains vary from a low of 904 cm cubed to a high of 1488 cm cubed. use the range rule of thumb to estimate the standard deviation s and compare the result to the exact standard deviation of 175.5 cm cubed, assuming the estimate is accurate if it is within 15 cm cubed
Answers: 2
Mathematics, 21.06.2019 22:00
Melanie is buying a bathing suit that costs 39.99. she is given a discount at the cash register of $6.00 when she scratched 15% off on a game piece for a store promotion. what will the sale price of melanie’s bathing suit be?
Answers: 1
Mathematics, 21.06.2019 22:30
Abag contains 10 white golf balls and 6 striped golf balls. a golfer wants to add 112 golf balls to the bag. he wants the ratio of white to striped gold balls to remain the same. how many of each should he add?
Answers: 2
Mathematics, 22.06.2019 00:30
Ahovercraft takes off from a platform. its height (in meters), xx seconds after takeoff, is modeled by: h(x)=-2x^2+20x+48h(x)=−2x 2 +20x+48 what is the maximum height that the hovercraft will reach?
Answers: 3
You know the right answer?
Choose the inequality that represents the following graph
A. x < 2
B. x ≤ 2
B. x ≤ 2
Questions

Mathematics, 13.09.2021 22:20

Social Studies, 13.09.2021 22:20


Computers and Technology, 13.09.2021 22:20

English, 13.09.2021 22:20
Mathematics, 13.09.2021 22:20
English, 13.09.2021 22:20

Business, 13.09.2021 22:20


Mathematics, 13.09.2021 22:20


