
Mathematics, 19.04.2021 01:00 carsonngibbons4354
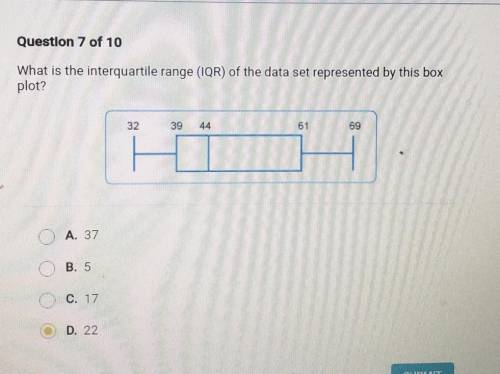
Question 7 of 10 What is the interquartile range (IQR) of the data set represented by this box plot? ਤੇ 61 B9 ਮ A. 37 E. 5 C 1

Answers: 1


Another question on Mathematics
Mathematics, 21.06.2019 20:30
26) -2(7x) = (-2 • 7) x a. associative property of addition b. associative property of multiplication c. commutative property of multiplication d. commutative property of addition
Answers: 1
Mathematics, 21.06.2019 22:00
The mean finish time was 185.52 with a standard deviation of 0.327 minute. the winning car driven by chris finished in 185.13. the previous year race had a mean finish time of 110.3 with a standard deviation of 0.106. the winning car that year driven by karen finished in 110.13 minutes. find their respective z-scores. chris - z-score karen “- z-score
Answers: 1
Mathematics, 21.06.2019 23:00
Afunction, f(x), represents the height of a plant x months after being planted. students measure and record the height on a monthly basis. select the appropriate domain for this situation. a. the set of all positive real numbers b. the set of all integers oc. the set of all positive integers od. the set of all real numbers reset next
Answers: 3
Mathematics, 21.06.2019 23:30
In the diagram, ab is tangent to c, ab = 4 inches, and ad = 2 inches. find the radius of the circle.
Answers: 3
You know the right answer?
Question 7 of 10 What is the interquartile range (IQR) of the data set represented by this box plot?...
Questions

Chemistry, 01.12.2020 01:00


Chemistry, 01.12.2020 01:00


Mathematics, 01.12.2020 01:00

Biology, 01.12.2020 01:00

Biology, 01.12.2020 01:00

English, 01.12.2020 01:00
Mathematics, 01.12.2020 01:00
Mathematics, 01.12.2020 01:00


