
Mathematics, 19.04.2021 17:40 CoolRahim9090
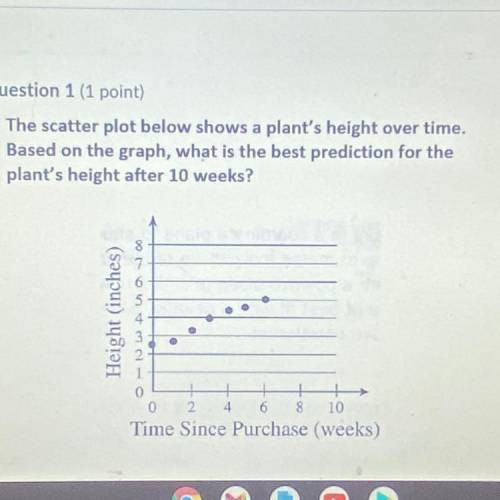
The scatterplot below shows a plant height over time based on the graph what is the best prediction for the plant height after 10 weeks

Answers: 1


Another question on Mathematics
Mathematics, 21.06.2019 19:30
If the ratio of sum of the first m and n terms of an ap is m2 : n2 , show that the ratio of its mth and nth terms is (2m − 1) : (2n − 1).
Answers: 1
Mathematics, 21.06.2019 22:00
In dire need~! describe how to use area models to find the quotient 2/3 divided by 1/5. check your work by also finding the quotient 2/3 divided by 1/5 using numerical operations only.
Answers: 3
Mathematics, 22.06.2019 01:00
X^2/100+y^2/25=1 the length of the major axis is: a)5 b)10 c)20
Answers: 3
You know the right answer?
The scatterplot below shows a plant height over time based on the graph what is the best prediction...
Questions
Mathematics, 08.02.2021 01:50

Mathematics, 08.02.2021 01:50

History, 08.02.2021 01:50

Computers and Technology, 08.02.2021 01:50
Mathematics, 08.02.2021 01:50


Mathematics, 08.02.2021 01:50
History, 08.02.2021 01:50
Mathematics, 08.02.2021 01:50

Biology, 08.02.2021 01:50
Mathematics, 08.02.2021 01:50
English, 08.02.2021 01:50


