
Mathematics, 19.04.2021 18:30 alyssamaize
Make a scatter plot of the data. Then tell whether x and y show a positive, negative, or no correlation
x 3.1 2.2 2.5 3.7 3.9 1.5 2.8 2.0
y 1 0 1 2 0 2 3 2

Answers: 1


Another question on Mathematics
Mathematics, 21.06.2019 17:30
Jacks bank statement shows an account balance of -$25.50. which describes the magnitude, of size, of the debt in dollars
Answers: 2
Mathematics, 21.06.2019 18:30
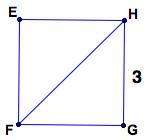
In right ∆abc shown below, the midpoint of hypotenuse ac is located at d and segment bd is drawn.if ab = 12 and bc = 16, then explain why bd = 10. hint: consider what you know about the diagonals of a rectangle.
Answers: 2
Mathematics, 21.06.2019 20:00
Need ! the total ticket sales for a high school basketball game were $2,260. the ticket price for students were $2.25 less than the adult ticket price. the number of adult tickets sold was 230, and the number of student tickets sold was 180. what was the price of an adult ticket?
Answers: 1
Mathematics, 21.06.2019 21:00
Check all that apply. f is a function. f is a one-to-one function. c is a function. c is a one-to-one function.
Answers: 3
You know the right answer?
Make a scatter plot of the data. Then tell whether x and y show a positive, negative, or no correlat...
Questions
Mathematics, 20.01.2020 04:31

Spanish, 20.01.2020 04:31


Geography, 20.01.2020 04:31

History, 20.01.2020 04:31
Physics, 20.01.2020 04:31


Business, 20.01.2020 04:31

Law, 20.01.2020 04:31
History, 20.01.2020 04:31
Law, 20.01.2020 04:31


