
Mathematics, 19.04.2021 18:40 XxKaitlynnxX
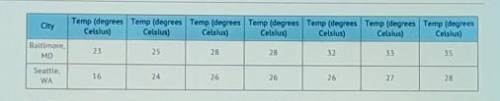
The table shows some temperatures recorded throughout October in Baltimore and Seattle. What could you infer by comparing the range of the data for each city?
A) Seattle's temperatures varied more throughout the month.
B) Baltimore's temperatures varied more throughout the month.
C. The temperatures in Baltimore and Seattle varied about the same for the month.
D) The typical day's temperature was higher in Baltimore than Seattle.

Answers: 3


Another question on Mathematics
Mathematics, 21.06.2019 14:30
Aparking lot is to be 400 feet wide and 370 feet deep. how many standard-sized cars fit in this lot considering a double-loaded (w4) two way traffic set up, an angle of 90° and a sw of 9’ 0’’? (do not consider handicapped parking spaces, and consider 15’ for turning aisles). show your work.
Answers: 2
Mathematics, 21.06.2019 15:00
The image of the point (-6, -2)under a translation is (−7,0). find the coordinates of the image of the point (7,0) under the same translation.
Answers: 1
Mathematics, 22.06.2019 00:00
City l has a temperature of −3 °f. city m has a temperature of −7 °f. use the number line shown to answer the questions: number line from negative 8 to positive 8 in increments of 1 is shown. part a: write an inequality to compare the temperatures of the two cities. (3 points) part b: explain what the inequality means in relation to the positions of these numbers on the number line. (4 points) part c: use the number line to explain which city is warmer. (3 points)
Answers: 2
You know the right answer?
The table shows some temperatures recorded throughout October in Baltimore and Seattle. What could y...
Questions
Mathematics, 24.07.2019 05:00


Biology, 24.07.2019 05:00


Mathematics, 24.07.2019 05:00
History, 24.07.2019 05:00

Social Studies, 24.07.2019 05:00

Chemistry, 24.07.2019 05:00
Mathematics, 24.07.2019 05:00


