
Mathematics, 19.04.2021 19:30 lovely222
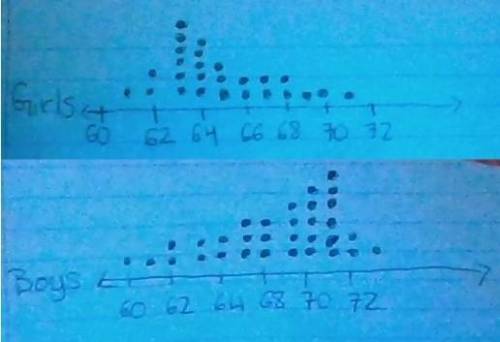
The dot plot shows the heights of the girls and boys in 2 seventh grades classes at Madison Middle School. Based on the data shown in the graphs, which statement is true?
F) The distribution for both sets of data is symmetrical.
G) The spread of the data distribution for the boys is greater than the data distribution for the girls.
H) The center of the data distribution is 2 times greater for the boys than the center of the data distribution for the girls.
J) The spread of the distribution for girls and boys differ by 1/2 inch.

Answers: 2


Another question on Mathematics
Mathematics, 21.06.2019 21:30
The price of a visit to the dentist is calculated according to the formula 50+100n50+100n where nn is the number of cavities the dentist finds. on your last visit to the dentist, 22 cavities were found. what was the cost of your visit?
Answers: 2
Mathematics, 21.06.2019 22:40
The value of x in this system of equations is 1. 3x + y = 9 y = –4x + 10 substitute the value of y in the first equation: combine like terms: apply the subtraction property of equality: apply the division property of equality: 3x + (–4x + 10) = 9 –x + 10 = 9 –x = –1 x = 1 what is the value of y?
Answers: 1
Mathematics, 21.06.2019 23:00
Acompany made a profit of 75000 over a period of 6 years on an initial investment of 15000 what is the annual roi
Answers: 1
You know the right answer?
The dot plot shows the heights of the girls and boys in 2 seventh grades classes at Madison Middle S...
Questions
Mathematics, 24.05.2020 23:57


English, 24.05.2020 23:57
Mathematics, 24.05.2020 23:57
Mathematics, 24.05.2020 23:57

History, 24.05.2020 23:57

History, 24.05.2020 23:57

Spanish, 24.05.2020 23:57
History, 24.05.2020 23:57
Mathematics, 24.05.2020 23:58

Business, 24.05.2020 23:58
English, 24.05.2020 23:58
Mathematics, 24.05.2020 23:58


