
Mathematics, 19.04.2021 20:10 atefah88
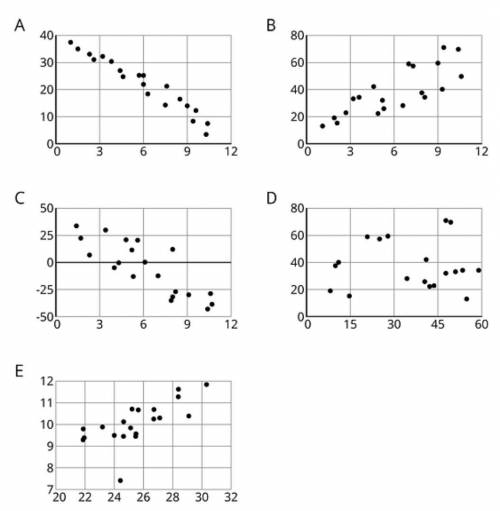
For each of the scatter plots, decide whether it makes sense to fit a linear model to the data. If it does, would the graph of the model have a positive slope, a negative slope, or a slope of zero?

Answers: 2


Another question on Mathematics
Mathematics, 20.06.2019 18:04
Point e(−5, 3) and point d(−4, −3) are located on the grid. which measurement is closest to the distance between point e and point d in units? a) 6.1 units b) 6.3 units c) 6.5 units d) 6.7 units
Answers: 2
Mathematics, 21.06.2019 20:00
Evaluate the discriminant of each equation. tell how many solutions each equation has and whether the solutions are real or imaginary. x^2 + 4x + 5 = 0
Answers: 2
Mathematics, 21.06.2019 20:30
1) you deposit $2,500 in an account that earns 4% simple interest. how much do you earn in eight years?
Answers: 1
Mathematics, 22.06.2019 02:00
Pleasseee important quick note: enter your answer and show all the steps that you use to solve this problem in the space provided. use the circle graph shown below to answer the question. a pie chart labeled favorite sports to watch is divided into three portions. football represents 42 percent, baseball represents 33 percent, and soccer represents 25 percent. if 210 people said football was their favorite sport to watch, how many people were surveyed?
Answers: 2
You know the right answer?
For each of the scatter plots, decide whether it makes sense to fit a linear model to the data. If i...
Questions
Mathematics, 22.11.2020 01:30

Mathematics, 22.11.2020 01:30
Mathematics, 22.11.2020 01:30
Mathematics, 22.11.2020 01:30

Biology, 22.11.2020 01:30

Mathematics, 22.11.2020 01:30

Social Studies, 22.11.2020 01:30
Biology, 22.11.2020 01:30
English, 22.11.2020 01:30
Mathematics, 22.11.2020 01:30
Mathematics, 22.11.2020 01:30

Mathematics, 22.11.2020 01:30
Mathematics, 22.11.2020 01:30


