1.
The box plot summarizes the attendance for the spring band concert and the
fall band conce...

Mathematics, 19.04.2021 20:30 jamaicandre7
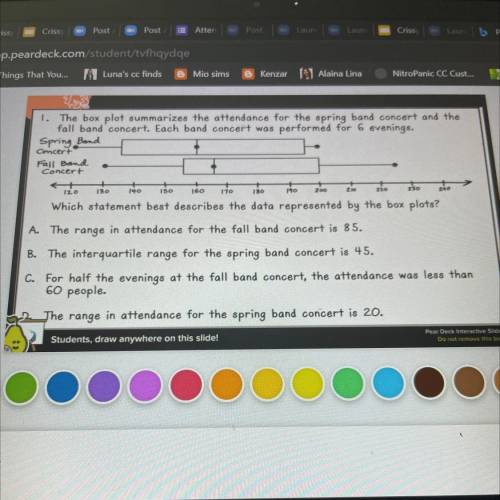
1.
The box plot summarizes the attendance for the spring band concert and the
fall band concert. Each band concert was performed for 6 evenings.
Spring Band
t
Fall Band
12
Concert
Concert
130
110
160
120
140
210
120
150
190
180
200
Which statement best describes the data represented by the box plots?
A. The range in attendance for the fall band concert is 85.
B. The interquartile range for the spring band concert is 45.
C. For half the evenings at the fall band concert, the attendance was less than
60 people.
2 The range in attendance for the spring band concert is 20.

Answers: 2


Another question on Mathematics
Mathematics, 21.06.2019 16:50
Ahiking trail is 6 miles long. it has 4 exercise stations, spaced evenly along the trail. what is the distance between each exercise station?
Answers: 3
Mathematics, 21.06.2019 20:00
Which part of a 2-column proof is the hypothesis of the conjecture? a) given b) reasons c) prove d) statements ! i think it's b but i'm not quite
Answers: 3
Mathematics, 21.06.2019 20:20
Which of the following best describes the delian problem?
Answers: 3
Mathematics, 21.06.2019 23:00
In an equilateral triangle, each angle is represented by 5y+3. what is the value of y? a. 9.7 b. 10.8 c. 11.4 d. 7.2
Answers: 1
You know the right answer?
Questions


Health, 13.11.2019 18:31

Mathematics, 13.11.2019 18:31
History, 13.11.2019 18:31


English, 13.11.2019 18:31
Physics, 13.11.2019 18:31
Social Studies, 13.11.2019 18:31


