
Mathematics, 19.04.2021 22:30 KayBJ2005
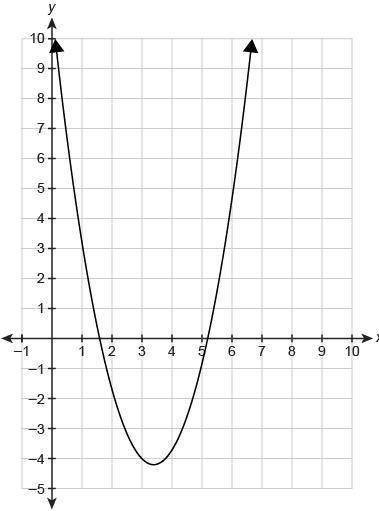
The graph shows the function f(x).
Which value is closest to the average rate of change from x = 1 to x = 3?
−3.5,
−2.3,
−1.8,
−0.3,

Answers: 1


Another question on Mathematics
Mathematics, 21.06.2019 17:30
Which of the following tables represents exponential functions?
Answers: 1
Mathematics, 21.06.2019 23:30
For the feasibility region shown below find the maximum value of the function p=3x+2y
Answers: 3
Mathematics, 22.06.2019 02:30
The slope of the line whose equation is 3y = 2x - 3 is 2 2/3 3/2
Answers: 1
Mathematics, 22.06.2019 03:30
You work for a landscape company that just got a contract to re-mulch a park. the area that needs mulching is 30 feet by 60 feet. they want a 3 inch layer of much on the area. the company has bags of mulch that cover 2 cubic yards that cost $4.00 per bag. how much will it cost the consumer just in materials to re-mulch the area (round to the nearest dollar)?
Answers: 3
You know the right answer?
The graph shows the function f(x).
Which value is closest to the average rate of change from x = 1...
Questions

Mathematics, 14.12.2020 17:30
Mathematics, 14.12.2020 17:30
Mathematics, 14.12.2020 17:30

Social Studies, 14.12.2020 17:30
Mathematics, 14.12.2020 17:30


Advanced Placement (AP), 14.12.2020 17:30
Mathematics, 14.12.2020 17:30

Biology, 14.12.2020 17:30
Social Studies, 14.12.2020 17:30

English, 14.12.2020 17:30
Mathematics, 14.12.2020 17:30

Mathematics, 14.12.2020 17:30
Mathematics, 14.12.2020 17:30


