
Mathematics, 19.04.2021 22:50 monicagalarza
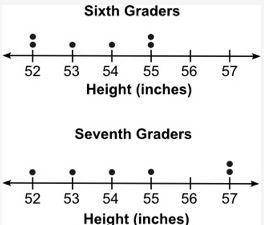
The two dot plots below show the heights of some sixth graders and some seventh graders:
The mean absolute deviation (MAD) for the first set of data is 1.2 and the MAD for the second set of data is 1.7. Approximately how many times the variability in the heights of the sixth graders is the variability in the heights of the seventh graders? (Round all values to the tenths place.)
1.2
1.4
2.4
2.8

Answers: 3


Another question on Mathematics
Mathematics, 21.06.2019 15:30
Planning for the possibility that your home might get struck by lighting and catch on fire is part of a plan for ?
Answers: 1
Mathematics, 21.06.2019 19:00
Witch represents the inverse of the function f(x)=1/4x-12
Answers: 1
Mathematics, 21.06.2019 22:30
What is the distance between a and b? round your answer to the nearest tenth. a coordinate plane is shown. point a is located at negative 1, 5, and point b is located at 4, 1. a line segment connects the two points.
Answers: 1
You know the right answer?
The two dot plots below show the heights of some sixth graders and some seventh graders:
The mean a...
Questions


Computers and Technology, 27.10.2020 19:40
History, 27.10.2020 19:40
Mathematics, 27.10.2020 19:40
Mathematics, 27.10.2020 19:40
History, 27.10.2020 19:40

English, 27.10.2020 19:40
Mathematics, 27.10.2020 19:40
Mathematics, 27.10.2020 19:40

Mathematics, 27.10.2020 19:40
History, 27.10.2020 19:40


