Mathematics, 26.08.2019 10:10 cyaransteenberg
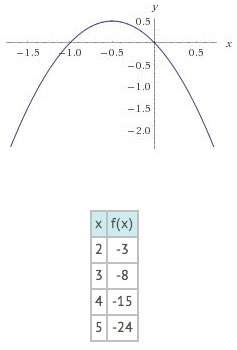
Compare the function represented by the table to the function represented by the graph to determine which statement is true.
a) the tabled function has a lessor minimum value.
b) the tabled function has a greater maximum value.
c) the graphed function has a lessor minimum value.
d) the graphed function has a greater maximum value.


Answers: 2


Another question on Mathematics

Mathematics, 21.06.2019 18:00
In a graph with several intervals o data how does a constant interval appear? what type of scenario produces a constant interval?
Answers: 1

Mathematics, 21.06.2019 18:50
In which form is the following function written? y = - 2(x – 3)(x + 5)
Answers: 1

Mathematics, 21.06.2019 20:00
Rectangle bcde is similar to rectangle vwxy. what is the length of side vy? a) 1 7 b) 2 7 c) 3 7 d) 4 7
Answers: 3

Mathematics, 21.06.2019 23:30
What is the explicit rule for the sequence in simplified form? −1,−4,−7,−10,−13… an=4−5n an=−4−3n an=2−3n an=−6−5n
Answers: 1
You know the right answer?
Compare the function represented by the table to the function represented by the graph to determine...
Questions

Mathematics, 10.02.2020 01:51


Mathematics, 10.02.2020 01:52


History, 10.02.2020 01:52


Mathematics, 10.02.2020 01:54


Chemistry, 10.02.2020 01:56

History, 10.02.2020 01:56


History, 10.02.2020 02:01


