Me somebody last ? ?
a group of students were surveyed to find out if they like building sn...

Mathematics, 24.08.2019 16:00 kingalbyss1230
Me somebody last ? ?
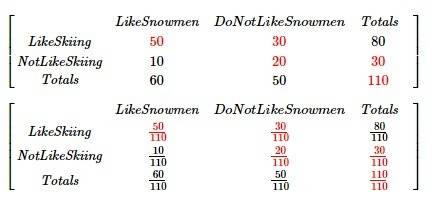
a group of students were surveyed to find out if they like building snowmen or skiing as a winter activity. the results of the survey are shown below:
60 students like building snowmen
10 students like building snowmen but do not like skiing
80 students like skiing
50 students do not like building snowmen
make a two-way table to represent the data and use the table to answer the following questions.
part a: what percentage of the total students surveyed like both building snowmen and skiing? show your work. (5 points)
part b: what is the probability that a student who does not like building snowmen also does not like skiing?

Answers: 2


Another question on Mathematics
Mathematics, 21.06.2019 14:40
The height of a triangle is 4 in. greater than twice its base. the area of the triangle is no more than 168 in.^2. which inequalitycan be used to find the possible lengths, x, of the base of the triangle?
Answers: 1
Mathematics, 21.06.2019 16:00
Determine the volume of a cylinder bucket if the diameter is 8.5 in. and the height is 11.5 in.
Answers: 1
Mathematics, 21.06.2019 21:00
What number line represents the solution set for the inequality -1/2 greater than or equal to 4
Answers: 1
You know the right answer?
Questions
Mathematics, 03.08.2021 20:20
Mathematics, 03.08.2021 20:20

English, 03.08.2021 20:20
English, 03.08.2021 20:20
English, 03.08.2021 20:20
English, 03.08.2021 20:20
English, 03.08.2021 20:20

Advanced Placement (AP), 03.08.2021 20:20

Business, 03.08.2021 20:20


Biology, 03.08.2021 20:20


