Agroup of 23 students participated in a math competition. their scores are below:
scor...

Mathematics, 26.09.2019 16:50 mike2910
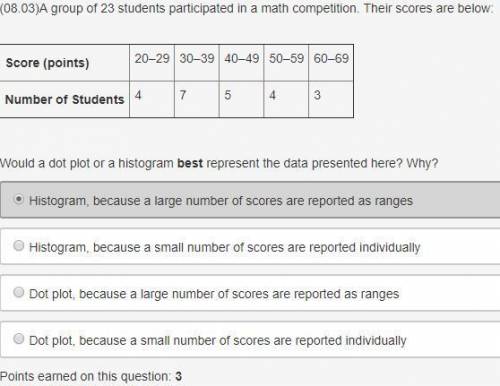
Agroup of 23 students participated in a math competition. their scores are below:
score (points) 20–29 30–39 40–49 50–59 60–69
number of students 4 7 5 4 3
would a dot plot or a histogram best represent the data presented here? why?
histogram, because a large number of scores are reported as ranges
histogram, because a small number of scores are reported individually
dot plot, because a large number of scores are reported as ranges
dot plot, because a small number of scores are reported individually

Answers: 2


Another question on Mathematics
Mathematics, 21.06.2019 20:30
If rt is greater than ba, which statement must be true ?
Answers: 1
Mathematics, 21.06.2019 23:00
What is the location of point g, which partitions the directed line segment from d to f into a 5: 4 ratio? –1 0 2 3
Answers: 1
Mathematics, 21.06.2019 23:40
Statement reason 1. δabc is similar to δced. given 2. 3. definition of slope 4. slope of slope of definition of slope 5. slope of × slope of multiplying the slopes 6. slope of × slope of substitution property of equality 7. slope of × slope of simplifying the right side the table contains the proof of the relationship between the slopes of two perpendicular lines. what is the reason for statement 2? a. parallel line segments that meet a common perpendicular line are proportional in length. b. the lengths of vertical and horizontal sides in congruent triangles are in a common ratio. c. trigonometric identities determine the lengths of the legs in a right triangle. d. corresponding side lengths in similar triangles are proportional in length.
Answers: 2
Mathematics, 22.06.2019 01:00
Urgent? will give brainliest to the first correct answer what is the area of the figure?
Answers: 3
You know the right answer?
Questions
Mathematics, 14.10.2019 20:10

Mathematics, 14.10.2019 20:10

Mathematics, 14.10.2019 20:10


Arts, 14.10.2019 20:10


Mathematics, 14.10.2019 20:10


