
Mathematics, 03.02.2020 15:53 elijahedgar876
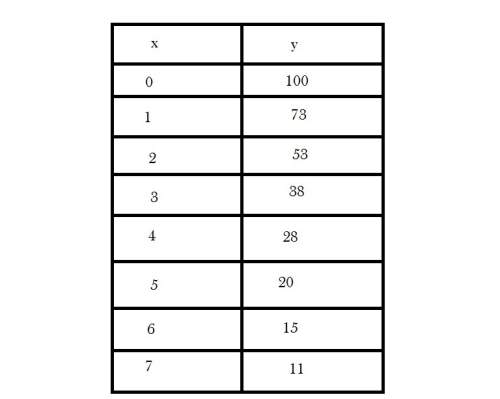
Suppose the data below are the result of a study of a medication used to fight a certain bacteria. the x column represents the number of hours after the medication was introduced to the bacteria and the y column represents the number of bacteria present. use the data in the table below to answer each question.
1. what does the scatterplot of the data show?
a. a strong positive linear relationship
b. a strong negative linear relationship
c. a curve that represents exponential growth
d. a curve that represents exponential decay
2. complete an exponential transformation on the y-values. what is the new value of y when x = 5?
a. 1.301
b. 0.699
c. 1.4472
d. 1.1761
3. find the linear transformation model.
a. log y^ (y-hat) = -12.1667x + 84.8333
b. log y^ (y-hat) = 84.8333x – 12.167
c. log y^ (y-hat) = -0.1375x + 1.9978
d. log y^ (y-hat) = 1.9978x – 0.1375
4. predict the number of bacteria present for 12 hours.
a. 0.35
b. 2.23
c. -61
d. 0

Answers: 3


Another question on Mathematics
Mathematics, 21.06.2019 18:00
Adj has a total of 1075 dance and rock songs on her system. the dance selection is 4 times the size of the rock selection. write a system of equations to represent the situation.
Answers: 1
Mathematics, 21.06.2019 20:10
Which value of m will create a system of parallel lines with no solution? y= mx - 6 8x - 4y = 12
Answers: 1
Mathematics, 21.06.2019 21:00
Rewrite the following quadratic functions in intercept or factored form. show your work. f(x) = 3x^2 - 12
Answers: 1
You know the right answer?
Suppose the data below are the result of a study of a medication used to fight a certain bacteria. t...
Questions


Mathematics, 20.07.2020 01:01

Computers and Technology, 20.07.2020 01:01


Health, 20.07.2020 01:01
Mathematics, 20.07.2020 01:01


