
Which of the following describes the function x4 − 3?
select one:
a. the degree of the...

Mathematics, 22.09.2019 18:30 06takmay48639
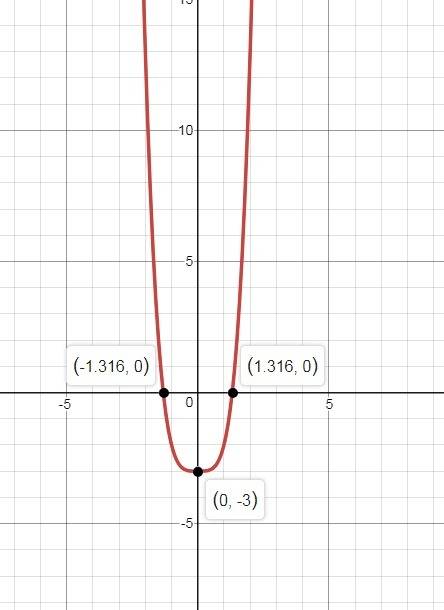
Which of the following describes the function x4 − 3?
select one:
a. the degree of the function is even, so the ends of the graph continue in opposite directions. because the leading coefficient is positive, the left side of the graph continues down the coordinate plane and the right side continues upward.
b. the degree of the function is even, so the ends of the graph continue in the same direction. because the leading coefficient is negative, the left side of the graph continues down the coordinate plane and the right side also continues downward.
c. the degree of the function is even, so the ends of the graph continue in opposite directions. because the leading coefficient is negative, the left side of the graph continues up the coordinate plane and the right side continues downward.
d. the degree of the function is even, so the ends of the graph continue in the same direction. because the leading coefficient is positive, the left side of the graph continues up the coordinate plane and the right side also continues upward.

Answers: 2


Another question on Mathematics
Mathematics, 21.06.2019 18:30
Write the slope-intercept form of the line that passes through the point (1, 0) and is parallel to x - y = 7. t
Answers: 2
Mathematics, 21.06.2019 22:30
Ineed big ! the cost of a school banquet is $25 plus $15 for each person attending. create a table, sketch the graph, and write an equation in slope-intercept and point-slope form that gives total cost as a function of the number of people attending. what is the cost for 77 people?
Answers: 1
Mathematics, 22.06.2019 01:30
Given are five observations for two variables, x and y. xi 1 2 3 4 5 yi 3 7 5 11 14 which of the following is a scatter diagrams accurately represents the data? what does the scatter diagram developed in part (a) indicate about the relationship between the two variables? try to approximate the relationship betwen x and y by drawing a straight line through the data. which of the following is a scatter diagrams accurately represents the data? develop the estimated regression equation by computing the values of b 0 and b 1 using equations (14.6) and (14.7) (to 1 decimal). = + x use the estimated regression equation to predict the value of y when x = 4 (to 1 decimal). =
Answers: 3
Mathematics, 22.06.2019 02:00
Multiply sixth of sixty six by a half of ten show step by step method
Answers: 1
You know the right answer?
Questions


History, 07.05.2021 07:20

Chemistry, 07.05.2021 07:20
Mathematics, 07.05.2021 07:20

Mathematics, 07.05.2021 07:20


Physics, 07.05.2021 07:20


