Mathematics, 18.01.2020 00:31 jamarstand
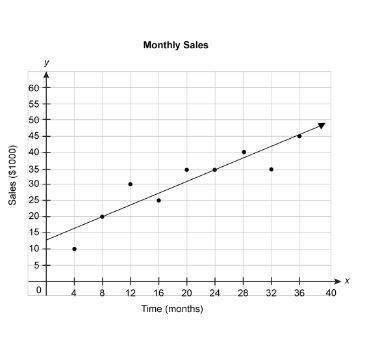
An employee compiled sales data for a company once each month. the scatter plot below shows the sales (in multiples of $1000) for the company over time (in months). the equation represents the linear model for this data.
y = 0.94x + 12.5
according to the model, how much do the company's sales increase per month?
$9400
$12,500
$1250
$5000
$940


Answers: 1


Another question on Mathematics


Mathematics, 21.06.2019 22:00
18 16 11 45 33 11 33 14 18 11 what is the mode for this data set
Answers: 2

Mathematics, 21.06.2019 22:10
Given: ae ≅ ce ; de ≅ be prove: abcd is a parallelogram. we have that ab || dc. by a similar argument used to prove that △aeb ≅ △ced, we can show that △ ≅ △ceb by. so, ∠cad ≅ ∠ by cpctc. therefore, ad || bc by the converse of the theorem. since both pair of opposite sides are parallel, quadrilateral abcd is a parallelogram.
Answers: 1

Mathematics, 22.06.2019 00:00
Y+ 2/y is it a polynomial in one variable or not? and if so, why?
Answers: 1
You know the right answer?
An employee compiled sales data for a company once each month. the scatter plot below shows the sale...
Questions


Mathematics, 04.06.2020 12:58


Geography, 04.06.2020 12:58

Mathematics, 04.06.2020 12:58


